Registration required

The content you have requested is available only to registered visitors. Please complete the short form below (all fields are required).

  • 简体中文 简体中文 Chinese (Simplified) zh-hans
  • English English English en
Listen, Inc.
  • Products
    • AUDIO MEASUREMENT
    • System Overview
      • What Soundcheck Measures
      • SoundCheck for R&D
      • SoundCheck for Production
      • Innovation
    • SoundCheck Software
      • Making Measurements
      • Algorithm Highlights
      • Integration
      • What’s New?
      • Packages, Modules & Pricing
      • Support Contracts
    • Audio Measurement Interfaces
      • AudioConnect 2 (2 channel))
      • AmpConnect 621 (6/2 channels)
      • AudioConnect 8×8 (8 channel)
      • AudioConnect 6×2 (6/2 channel)
      • AmpConnect ISC (2 channel)
      • 3rd Party Audio Interfaces
    • Audio Testing Hardware
      • Microphones & Amplifiers
        • Measurement Microphones
        • Microphone Power
        • Audio Test Amplifier
      • Specialist Test Interfaces
        • Bluetooth Audio Measurement Interfaces
        • MEMS microphone Interfaces
        • DC Connect
      • Audio Test Accessories
        • Turntables
        • Halo Automotive 6-Mic Array
        • Automotive Audio Test Kit
        • The SCC-1 Ear Coupler
        • Other Measurement Transducers
        • Impedance Box
        • Calibrators
    • NOISE & VIBRATION MEASUREMENT
    • System Overview
    • NoiseCheck Software
    • Noise & Vibration Interfaces
    • Noise and Vibration Testing Hardware
  • Applications
    • Headphones & Headsets
    • Loudspeakers & Microspeakers
    • Microphones
    • Automotive
    • Communications
    • Smart Devices
    • Hearing Aids
    • Audio Electronics
  • Support
    • Get Support
    • User Documentation
    • Knowledgebase
    • Training
    • Sequences & Resources
    • Drivers
    • Register Product
    • Report a Bug / Request a Feature
  • Resources
    • ‘Sound Matters’ Blog: Audio Measurement Expertise
    • Test Sequences
    • Article Reprints
    • Published Papers
    • Technical Notes
    • Measurement Services
    • Useful References
  • News & Events
    • News
    • Events
  • About Listen
    • Listen, Inc.
    • Contact
    • Distributors & Reps
    • Careers
    • Privacy Policy
  • Menu Menu

How Changing Industry Needs are Shaping Audio Test and Measurement

November 9, 2026/in Blog, SoundCheck Functionality Videos, Videos/by Renee Lucas

As 2026 draws to a close, we’re taking a look at how the demands of audio test and measurement have changed over the past few years. Audio products are becoming increasingly sophisticated, and so too are the challenges facing test engineers. Here are five key trends that are influencing how audio products are measured and tested.

Increasing product complexity: Modern audio products often incorporate multiple microphones, loudspeakers, advanced signal processing, and adaptive technologies. Understanding the interactions between components, while also accommodating multiple connection modes such as Bluetooth, Wifi, USB, and wired audio, creates increasingly diverse measurement requirements. This is particularly evident in applications such as automotive audio, noise-canceling headphones, and smart devices.

Greater emphasis on perceived audio quality: Objective measurements remain essential, but measured performance doesn’t always correlate directly with what listeners hear. Engineers face growing pressure to identify defects that affect perceived quality while avoiding unnecessary rejection of products for inaudible imperfections.

Pressure to improve testing efficiency: Faster product development cycles, increasingly complex test requirements, and production cost pressures demand more efficient measurement processes. Measurement accuracy and repeatability need to be balanced with the need to develop, deploy, and execute tests quickly.

Consistency across global supply chains: With product development, component manufacturing, and assembly often distributed across multiple suppliers and geographic locations, maintaining consistent measurement standards is increasingly challenging. Ensuring that results are accurate, repeatable, and comparable across different equipment, test environments, procedures, and operators is essential.

Growing importance of connectivity and data: Audio measurements are increasingly part of larger development and manufacturing ecosystems. Test results need to be accessible, traceable, and meaningful beyond the individual measurement, whether for quality control, long-term performance analysis, or integration with other engineering and business systems.

How are we addressing these needs?

Over the past several releases, SoundCheck has introduced a wide range of new capabilities that reflect these changing requirements. Enhanced perceptual distortion algorithms help engineers distinguish between measurable and audible defects, while expanded real-time analysis and visualization tools provide deeper insight into complex acoustic systems.
New workflow capabilities, such as FastTrak and Calibration Profiles, simplify everything from initial measurement setup and calibration to test sequence development and deployment. Sequence versioning and protection help maintain test consistency across different systems and locations, while Python integration and enhanced metadata make it easier to incorporate audio measurements into larger automated systems and data-analysis workflows.
Our latest video takes a closer look at these developments, demonstrating how new measurement techniques and software capabilities are helping engineers address today’s audio testing challenges.

Is your SoundCheck system keeping pace with your measurement needs? If you’re using an older version, you may be missing out on capabilities that could make your testing faster, easier, and more effective. Contact Listen or your local representative to find out what’s changed since your last upgrade and how the latest features could benefit your measurement workflow.

https://www.listeninc.com/wp/media/2026/11/Whats-new-in-SoundCheck-scaled.png 1440 2560 Renee Lucas https://www.listeninc.com/wp/media/logo.png Renee Lucas2026-11-09 15:27:412026-11-10 16:19:26How Changing Industry Needs are Shaping Audio Test and Measurement

2026 End Of Year Promotions

November 1, 2026/in Product News/by Zarina

To celebrate the end of the year, we’re offering a multitude of sweet deals on everything from multi-year support contracts and SoundCheck modules, to new hardware products and more. Keeping your team up-to-date with the latest in audio measurement technology is the perfect way to utilize any remaining 2026 budget.

Whether you’re looking to make automotive audio measurements, change out old hardware, or upgrade your software, our deals provide tremendous value, and they won’t last long. Check out the deals below!

Read more
https://www.listeninc.com/wp/media/logo.png 0 0 Zarina https://www.listeninc.com/wp/media/logo.png Zarina2026-11-01 12:48:282026-11-09 15:22:482026 End Of Year Promotions

Smarter SoundCheck Sequences with Loops and Logic

October 29, 2026/in Blog/by Zarina

SoundCheck test sequences typically execute one step after another, but not every test needs to follow exactly the same path every time. Sometimes you need to repeat the same measurement at multiple positions or levels, or need to repeat a measurement while changing a test parameter. In other cases, you may want what happens next to depend on whether a measurement passes or fails.

Sequence loops and step logic make this possible. Much like loops and if/then statements in a programming language, they let you build repetition and decision-making directly into a SoundCheck sequence. This simplifies complex tests, increases automation, reduces sequence development time, and minimizes sequence maintenance.

Do more with fewer sequence steps

Loops are useful whenever the same group of measurements needs to be repeated while something changes, for example you might want to increase the stimulus level and re-test, make measurements at multiple frequencies, play different WAV files, or rotate a turntable between measurements to create a directivity plot.  Rather than duplicating those steps throughout the sequence, you can create them once and place them inside a loop.

Consider a directivity measurement using a turntable. You might want to measure frequency response every 10 degrees through a complete rotation. Instead of creating 36 separate sets of measurement steps, you can create one set and loop it 36 times, with a turntable step changing the loudspeaker position on each pass.

This makes the sequence much easier to build and, importantly, much easier to maintain. If you later decide to add a distortion measurement, for example, you only need to add it once. Without the loop, that same change would have to be made correctly in all 36 sets of steps.

Automatically change parameters as you loop

Loops don’t have to repeat exactly the same test each time. Variables can be changed or incremented on each pass, allowing a sequence to systematically step through a range of test conditions.

For example, the stimulus level could increase by 3 dB each time the loop runs. The same approach can be used to change frequencies, positions, operating conditions, or other test parameters. This makes it possible to automate an entire series of related measurements with a relatively compact sequence.

Use pass/fail results to control what happens next

Step logic adds another level of flexibility by allowing the sequence to change what it does according to conditions or results.

This can be as simple as responding to an operator choice. A dialog might ask whether a Bluetooth device needs to be connected. If the operator selects No, logic can skip the Bluetooth connection instructions and continue directly to the next relevant part of the test.

Logic can also respond to measurement results, for example whether a device passes or fails a limit.This allows the sequence to make decisions automatically rather than simply executing every step regardless of what has already happened. On a production line, a failed limit could bypass unnecessary remaining measurements and reject the product.

Combine Loops and Logic

Loops and logic are particularly powerful when they are used together. For example, a sequence could repeatedly increase stimulus level, measure the device, compare the result against a limit and use that result to determine whether to continue increasing the level or exit the loop. This is used in our AES 75 measurement test sequence and our automotive Max SPL at 10% distortion test sequence. Both of these rely on sequence loops and logic to incrementally increase a test signal until distortion exceeds a certain level, then iterate in smaller increments to ascertain the level with tighter precision, before progressing to the next measurement.

Automating sequences with loops and logic like this results in a high degree of automation, with a test sequence that responds intelligently to the device, measurement results or operator input rather than simply executing every step in a fixed order. It also makes sequences shorter, faster and easier to create and maintain, and much more adaptable.

Learn how to use loops and logic in SoundCheck

If you’re interested in simpler, faster, more automated test sequences, check out our Knowledgebase article, “Using Loops and Logic in SoundCheck Sequences.” It explores how to configure various loop and logic options including “Jump on Pass”, “Jump on Fail”, “
After n Repetitions” and the “Loop Index”, with examples showing how these features can be applied to real-world SoundCheck tests.

https://www.listeninc.com/wp/media/2026/10/loop_data.png 689 1379 Zarina https://www.listeninc.com/wp/media/logo.png Zarina2026-10-29 15:55:292026-10-29 15:56:12Smarter SoundCheck Sequences with Loops and Logic

Audio Basics: Polarity

October 22, 2026/in Audio Basics, Blog/by Renee Lucas

Polarity is a fundamental property of a transducer, such as a loudspeaker, that describes the direction of its acoustic output relative to the input signal. If you’re wondering what loudspeaker polarity means, how to test speaker polarity, or why polarity is important in loudspeaker systems, this short educational video explains polarity, how polarity inversions affect system performance, and how engineers can measure polarity during production testing.

Watch the Video Here:

Transcript:

Polarity is another fundamental property of a transducer, such as a loudspeaker, and describes the direction of its acoustic output relative to the input signal.

A speaker converts an electrical signal into an acoustic one. 

In a system with correct polarity, a positive input signal causes the cone to move outwards, producing a positive acoustic pressure at the output. If the speaker has been incorrectly wired, a positive signal will cause the cone to move backwards, producing a negative acoustic pressure at the output.

Now imagine the output when you put a sine wave into the speaker: with the correct polarity, you get the same signal out. If your polarity is reversed, your acoustic pressure is negative.

If a speaker is listened to in isolation, this reversed polarity might not be obvious. However, when individual drivers are assembled into a system, it is important that all polarities are aligned. Incorrect polarity can cause partial or complete cancellation between sources, reducing low-frequency output and disrupting overall coherence.

Polarity is a binary property –  it is either correct or inverted. Unlike frequency and phase response, it does not vary with frequency. Polarity inversions can be introduced through wiring errors in the manufacturing process, so a polarity check is an important end-of-line QC test.

Although the simplest way to test polarity is to apply a DC voltage to a speaker and observe if the diaphragm moves outward or inward, this isn’t practical for production line testing.

On the production line, polarity measurements are typically implemented simultaneously with tests like frequency and phase and there are a couple of ways we can do this.

One method is to place limits in the phase response curve, since incorrect polarity results in a  180 degrees phase-shift. An alternative is to calculate an impulse response of the current measurement, and examine whether the peak has a positive or negative value, and apply a limit to this to generate a pass/fail verdict.

Ensuring correct polarity is a basic but critical step in transducer quality control. Alongside frequency and phase response, it helps ensure accurate and consistent sound reproduction.

https://www.listeninc.com/wp/media/2026/10/Audio-Basics-Polarity-TN-scaled.png 1440 2560 Renee Lucas https://www.listeninc.com/wp/media/logo.png Renee Lucas2026-10-22 08:35:122026-10-22 08:35:12Audio Basics: Polarity

How to Measure: Haptics

October 15, 2026/in Blog, Haptic Device Videos, Videos/by Renee Lucas

SoundCheck is commonly used for measuring sound, but did you know it’s also useful for measuring vibration? This short demonstration walks you through how to measure vibration and haptic intensity, what hardware is required, how to configure that hardware with SoundCheck, and how to perform vibration level vs time and resonant frequency measurements.

Watch this Video Demo

Learn More about Measuring Haptics

  • Haptic Measurement Sequence: https://www.listeninc.com/haptic-sequence/

Video Transcript: How to Measure Haptics

Usually we use SoundCheck to measure sound, but did you know that you can also use it to measure vibration? This is valuable if you have a device that produces tactile alerts as well as audible ones, like phones or watches, or even for evaluating seat vibrations that enhance low frequency playback in cars.

Let’s take a look.

The test setup is very similar to an audio measurement. The main difference is that instead of capturing sound with a microphone, we use an accelerometer. First I’m going to show you how we can use this to measure different vibration intensities on a phone, then I’ll show you the signatures produced by different ringtones on a watch. 

To capture the vibration, I’ll use a B&K Type 4534 B accelerometer. I’ll connect this to input 1 on my AudioConnect 2 audio interface, which is connected via USB to the SoundCheck computer for our acquisition and analysis. The accelerometer requires IEPE bias, so I’ll set that on input 1 of my AudioConnect 2 in the hardware configuration. This is a TEDS accelerometer, and AudioConnect 2 is TEDS compatible, so I can simply read my calibration data from the accelerometer. If you’re using a different type of audio interface, you may need to manually calibrate it. If you want to know more about how to do this, check out our quick tip video on using accelerometers with SoundCheck.

First I’ll measure vibration intensity on a phone.

SoundCheck isn’t configured to control the vibration so I’ll do this manually. For this demo, I’ve downloaded an app called HapticsTouch that lets me customize the vibration pattern, and I’ve created three different intensity vibrations, high, medium and low. If you’re the phone manufacturer with full access to the device, you can control this directly from SoundCheck with a Python script or via TCP/IP. Other devices such as shakers can be excited by simply sending voltage directly from SoundCheck via a calibrated amplifier such as the one built into Listen’s AmpConnect 621.

I’ll attach the accelerometer to the front of the phone with sticky tack, making sure I have a secure connection.

Now I’ll run my SoundCheck sequence. It prompts me to start with the high intensity vibration, so I’ll just start that from my phone – that’s working – I can feel it – and say OK. It’s now making a 3 second acquisition to capture the vibrations. It’s got that – now it wants me to play the medium intensity, so I’ll start it and hit OK. And now the low intensity…

And here are our results…

We can see the acquired waveforms – that’s the raw data… our FFT spectra… level vs time… and resonant frequency of each intensity. If you’re testing in a production environment, you could use a golden unit to set limits on level, sensitivity, and more to ensure there is no erroneous shaking or rattling in your device.

Now let’s take a quick look at the test sequence. 

As you can see we have 3 message steps instructing us to start the vibrations, each is followed by a 3 second acquisition step. Once we’ve collected the data, we take an FFT of the waveforms using an analysis step to get the spectra. And post-processing steps are used to get the level vs time and resonant frequencies.

We can also use the same sequence to look at the haptic signatures of various ringtones. For this one, I’m going to use a watch. Again I’ll attach the accelerometer to the back of the device with sticky tack.

This sequence is very  similar. On the haptics side I’ve simply renamed the inputs to Ringtones 1, 2 and 3 to make it easier to follow. I’ve also added an SCM measurement microphone to the other input of the AudioConnect, and added a simultaneous audio acquisition step to the sequence.

For this measurement, I’m using my phone’s default watch app, and triggering the acquisition by starting the ringtone.

Let’s start it. I’ll tell the sequence I’m ready, then I’ll use my phone to play the first ringtone on the watch, this one’s called pebbles. 

And the second…focus

And the third…. jingle

Let’s take a look at our results…I’m showing all 3 ringtones on the same graph.

On the left hand side we have our haptic analysis. Here you can see we have the raw waveform…  the spectrum…  and the level vs time for each ringtone. On the right hand side, we show the acoustic waveform and FFT.

So, as you can see, haptic measurements are pretty straightforward in SoundCheck, and can easily be made simultaneously with acoustic measurement.

I hope you found that interesting. If you want to try it out, head on over to our website and download the sequence from the test sequences section under the resources menu.

https://www.listeninc.com/wp/media/2026/10/Haptics-Thumb-Nail-scaled.png 1440 2560 Renee Lucas https://www.listeninc.com/wp/media/logo.png Renee Lucas2026-10-15 13:18:122026-10-15 13:18:12How to Measure: Haptics

Practical Automotive Audio Measurements-Cupertino

October 1, 2026/in All Events, News & Events/by Renee Lucas

Location: Hilton Garden Inn, Cupertino, CA

Date & Time: Thursday, November 19  •  8:30 AM – 3:30 PM


Join us for an engaging and informative day of practical automotive audio measurements and training.

In the morning Steve Temme will share the work of the AES Technical Committee on Automotive Audio (TC-AA) and their development of a white paper to standardize measurements of frequency response, Max. SPL and impulsive distortion. He will then delve deeper into some of the other audio characterization metrics that help develop a more complete picture of in-car audio quality. These include seat-to-seat spectral uniformity, Max SPL versus distortion and alternative methods for impulsive distortion measurements.

After a short break Dr. Sean Olive will present a framework that defines the objective and subjective measurements needed to build accurate and reliable generalized predictive models of automotive sound quality

After a networking lunch, we’ll head outside for a hands-on session making some real in-car measurements and offer hands-on guidance in making these measurements.

There is no charge for this event, but registration is required and spaces are limited.

https://www.listeninc.com/wp/media/2026/10/Presents-3.png 1080 2160 Renee Lucas https://www.listeninc.com/wp/media/logo.png Renee Lucas2026-10-01 12:27:572026-10-01 12:27:57Practical Automotive Audio Measurements-Cupertino

The Value of Big Data

September 28, 2026/in Blog/by Renee Lucas

There’s been a lot of recent discussion about AI in audio test and measurement and some companies in our industry are openly talking about using data collected from customer production lines to train their models. The premise is simple: the more real-world manufacturing data you have, the better your algorithms will become. This raises 2 big questions: 

  • Is the data truly valuable?
  • Is this ethical?

For me, the answer is “Rarely” and “No”. Let me explain.

Is More Really Better?

A database with ten million loudspeaker measurements is an intriguing proposition, but I’d have a lot of questions before I relied on any of that information to develop an algorithm. What products were being measured? What measurement hardware was used? What were the precise test parameters – the stimulus signal, the specific algorithm used, etc.? What was the background noise level? Do we have the raw time recordings? Are there subjective listening results so we  know what an experienced listener actually heard? And even with answers to all of those questions, I would still need to trust that the test was performed competently and repeatably with a calibrated system and sufficient signal-to-noise ratio.

Making good audio measurements is never as simple as just connecting a microphone and pressing a button. This is particularly true on a production line, where there is constant pressure to maximize yield and throughput, and operators sometimes find very creative solutions to the problem immediately in front of them.

Once, at a customer’s production facility, an operator showed me just how easy it was to get a speaker with bad Rub & Buzz to pass the end-of-line test. He simply opened the test box and introduced background noise during the measurement. The noise masked the higher-order harmonic distortion, and suddenly the failing speaker passed the test. The yield went up, but of course the manufacturer’s reputation for quality didn’t! Now imagine that result being automatically added to a large dataset and subsequently used to train or refine an algorithm. The data says the speaker passed, but anyone who observed the measurement knows the data is worthless.

It’s not always that intentional. Recently, someone challenged a measurement I made as it didn’t agree with the manufacturer’s data or previous measurements made by a well-known third party. We had three different results for the same speaker, all made by highly qualified, experienced engineers using different test equipment, and mine was the outlier. A deep dive into the test conditions for each measurement revealed the source of the discrepancy: the measurement space. When the speaker was re-measured outdoors, many feet in the air in the middle of a large field, to approximate a free-field environment, the results demonstrated that SoundCheck’s nearfield/farfield “splice” technique was accurate and that limitations in the other measurement setups accounted for the discrepancies.

If I had been handed those three sets of results without knowing how they were obtained, which one should I have treated as correct? And if all three had been anonymously added to a huge database, what would an AI model have learned from them?

This is the fundamental problem with the idea that simply harvesting vast quantities of real-world measurement data will produce better algorithms. Calibration, equipment, environment, test configuration and operator behavior all affect the result. Without that context, you might have a lot of numbers, but it’s not a valuable dataset.

The Value of Trusted Data

This doesn’t mean real-world customer data isn’t useful. Some of our most successful algorithms have been developed with it. The difference is that we know what the data represents.

For example, our perceptual distortion algorithms were developed using customer-supplied defective speakers together with subjective listening results. We could measure the same devices repeatedly under controlled conditions, compare the results with what experienced listeners actually heard, and experiment with different analysis techniques. The value wasn’t the quantity of data; it was knowing exactly what we were measuring and having the context to interpret the results.

The same principle applies if AI becomes part of audio test and measurement. Our measurement algorithms don’t currently rely on AI or massive datasets, although I can certainly see applications for AI in the future, such as intelligent production limit setting. If we go down that road, I would rather start with a hundred measurements I understand and trust than millions I don’t. “Garbage in, garbage out” has never been more relevant.

Whose Data Is It Anyway?

Even if indiscriminately collected production data were enormously valuable, it’s not ours to collect.  Our customers use SoundCheck to develop unreleased products and manufacture millions of devices. Their measurement data can reveal not only technical details about their products, but commercially sensitive information such as production volumes and manufacturing relationships.

We welcome customers sharing data or defective products with us, under NDA if requested, as this is invaluable for developing our algorithms. However, there are two important distinctions: 1) the customer is choosing to give us that data and knows exactly what they have shared, and 2) because we know where it came from, we can ask questions to understand the context behind the measurements.

This is very different from viewing an installed customer base as a source of training data – an approach I have seen proposed by one company in our industry. They clearly see customer data as valuable for improving their algorithms and gaining a competitive advantage, but that doesn’t make it theirs to take. 

Transparency is important. If a test equipment vendor is collecting customer data, their customers should know exactly what is being collected, where it goes, and how it will be used. And if that data is being used to develop future commercial products or algorithms – which may then be sold to their competitors – there should be no ambiguity about that either.

When was the last time you checked your test equipment vendor’s privacy and data collection policy?

Your Data, Your AI

Perhaps there is a better approach? Rather than measurement companies collecting data from thousands of customers to develop generalized AI models, I believe some of the most valuable applications of AI will come from customers using their own data. After all, you know exactly what product was tested, how it was measured and what constitutes an acceptable or unacceptable device. Measurement results can be combined with proprietary information such as manufacturing parameters, component changes, failure analysis, warranty returns and subjective evaluations. That makes your own carefully curated dataset infinitely more valuable than millions of unrelated measurements collected elsewhere.

SoundCheck facilitates this. Test results can be saved with relevant metadata and exchanged with external applications via TCP/IP. This enables you to use your SoundCheck measurements with your own AI tools, while keeping your data and intellectual property under your control.

And to be absolutely clear, SoundCheck does not secretly collect your measurement data. It does not send your measurements, test results, production statistics or other information back to Listen, and there is no telemetry running in the background. SoundCheck functions perfectly well offline, as it always has. In fact, many production lines, particularly in China, aren’t connected to the internet at all.

This is a deliberate choice. We believe our role is to give customers accurate, trustworthy measurements, preserve the context that makes those measurements meaningful, and provide the tools to use that data however they choose – including with their own AI.

https://www.listeninc.com/wp/media/2026/09/Trusted-data-1.png 887 1774 Renee Lucas https://www.listeninc.com/wp/media/logo.png Renee Lucas2026-09-28 11:57:262026-09-28 11:57:26The Value of Big Data

Audio Basics: Phase Response

September 17, 2026/in Audio Basics, Blog/by Renee Lucas

What is phase response? Why is it useful in audio testing? Phase response is one of the most fundamental measurements used to describe the behavior and linear performance of a transducer, such as a loudspeaker. It describes the phase relationship between a transducer’s input signal and its acoustic output as a function of frequency. This short educational video provides a clear engineering explanation of phase measurements and their role in electroacoustic testing.


Watch the Video Here:

Video Transcript:

Phase response is another fundamental way to describe the behavior of a transducer, such as a loudspeaker.

While frequency response tells us how much output a speaker produces at each frequency, phase response tells us when that output arrives relative to the input signal.

Ideally, all frequencies would have the same time delay like they were emanating from a point source. This would result in a minimum phase response.

In reality, physical and electrical factors such as mass and compliance, enclosure behavior, resonances, and crossover networks introduce frequency-dependent phase shifts. This means different parts of the spectrum arrive at different times, and the phase is not linear across the frequency range.

This is important because the sounds we listen to, like music and speech, contain many frequencies simultaneously. When those frequencies are no longer time-aligned, transients become smeared, clarity is reduced, and spatial imaging is degraded. 

To measure phase, typically we play a test signal – usually a 20Hz to 20kHz continuous sine sweep or log chirp – through a speaker, and capture the acoustic output with a calibrated precision microphone in a controlled environment. This is transmitted, via an audio interface to a computer where FFT-based transfer functions are used to compare the input signal to the output. This extracts both the magnitude and phase components of the system’s transfer function. 

We then plot phase response in degrees against frequency. Like frequency response, ideally this is consistent over the frequency range, but in practice it varies.

Phase measurements are essential for aligning drivers, designing and optimizing crossovers, configuring microphone arrays, and ensuring coherent system behavior.

Taken together, frequency response and phase response provide a complete description of a transducer’s linear performance.

https://www.listeninc.com/wp/media/2026/09/Phase-Response-Image-scaled.png 1440 2560 Renee Lucas https://www.listeninc.com/wp/media/logo.png Renee Lucas2026-09-17 11:00:182026-09-22 12:59:31Audio Basics: Phase Response

USB Headset Measurement

August 19, 2026/in Audio Measurement Videos, Blog, Headphone & Headset Videos/by Julius Wijono

How do you measure USB headsets? In this short video, we demonstrate how to measure USB headsets using SoundCheck. You’ll see how to configure digital input and output channels, set up the headset in the hardware editor, and perform measurements including left and right earphone frequency response, THD, sensitivity, and microphone performance. This method can be used for any USB audio device, making it easy to accurately evaluate both playback and recording performance.

Watch this Video Demo of Measuring a USB Headset

Learn More about USB Headsets

    • USB Headset Input/Output Test Sequence: https://www.listeninc.com/resources/test-sequences/usb-headset_input_output_sequence/

Video Transcript: How to Measure USB Headsets

Today I’m going to demonstrate how we can measure a USB headset using SoundCheck. We’ll test both the left and right ears and the microphone.

SoundCheck supports both analog and digital inputs and outputs, so to test a USB headset, all we need to do is plug it into our computer’s USB port and configure a new digital channel in the hardware setup, then we can test it just like a conventional headset. 

Let’s review our setup. We’ll use a head and torso simulator to capture the headset’s response, and I’m powering that with a SoundConnect 2 power supply. The microphones within HATS transmit the signal to the computer via the AmpConnect 621 Audio Interface, and that also has a built-in amplifier to power the HATS mouth, which we need for the microphone test.

First, I’ll configure the USB headset in SoundCheck. We do this in the Hardware Setup. You can see here we already have the input and output channels of the AmpConnect 621 configured  – it’s full plug and play so that happens automatically. 

I’ll plug the USB headset into the USB port of my laptop. In the hardware editor, I’ll right click to create an input channel. I’ll set it to use the Windows WDM driver, and now it shows me all the available devices. We see the headset mic there – let’s set the type to digital. Since it’s digital we don’t need to enter anything in the calibration field. I’ll leave the sampling rate as the default, as my audio interface is using this value. We’ll also do the same for the outputs. We’ll set the driver and pick the device, there’s 2 channels so we’ll set these to left and right, and again it’s a digital device. 

First we’ll measure the headphone response, and we’ll use the USB headset test sequence that’s available for free on our website. 

When we open our sequence, it prompts us to re-link the signal paths used in the sequence. Let’s add them to system calibration.

And now we need to assign hardware channels and calibration files. It’s warning me that the signal paths I just added don’t have associated hardware channels and calibration data, so we’ll click through all of those so we can add them. Here’s our signal paths.

We’ll assign signal paths digital out 1 and 2 to USB Headset out L and R. Since these are digital outputs the calibration is unity digital out

Now we’ll do the same for the input headset sequence. We’ll set Digital In 1 to the USB headset and calibration to unity digital in

Let’s just do a quick check and make sure all our signal paths are correct. It’s looking good

So now we’re all set up and ready to measure. 

Let’s hit start. 

The sequence plays our test stimulus, and it gives us the left and right frequency response, and also the THD for the left and right earphone. Over here we see the waveforms, the left and right recorded response, and down here we calculate our average sensitivity. Sensitivity is a useful production line test to confirm that the average level across a bunch of headphones is reasonably stable. If the sensitivity swings dramatically in either direction from sample-to-sample, it can indicate a quality problem in manufacturing. We also show the left/right tracking – that’s the difference in sensitivity between the left and right ear over the frequency range.

Now we have some results, let’s take a look behind the scenes at what our test sequence is doing.

We’re using a Stweep that sweeps from 20 kHz down to 100 hertz at 12th octave resolution. This is a compound stimulus with a very short, 1kHz pilot tone, before the Stweep. The pilot tone isn’t analyzed, but we use it in this frequency shift step here  to align the time and phase of the response signal with the stimulus before we analyze it.

This feature ensures accurate analysis. It compensates for any unknown phase differences that are introduced from the stimulus and response being played through different hardware devices – the stimulus is played through the laptop via USB, and the response is recorded through our audio interface.

Next, our analysis step compares the stimulus waveform with the frequency-shifted version of the response waveform to get the fundamental. There’s also a post-processing curve averaging step that calculates the average sensitivity.

Lastly, the display step that defines what graphs and results are shown. So that’s the earphones, now let’s test the microphone. We’re already connected and set up, so I’ll tell the sequence to continue and measure the microphone.

So that’s the earphones, now let’s test the microphone. We’re already connected and set up, so I’ll swap over to the microphone test sequence and measure the microphone.

We heard our test stimulus coming out of the HATS mouth, and being recorded by the headset microphone. And here we can see the frequency response and sensitivity of the microphone.

And if we look at the sequence, we can see it’s very similar to the headphone. We’re using an 8 Khz to 100Hz test stimulus, again with a trigger tone to align our stimulus and response waveforms. We have our frequency shift calculation, just like before. Then our analysis step to calculate  frequency response, and also a post-processing step to calculate sensitivity. And of course we have a display step to determine what is shown on screen.As you can see, because SoundCheck supports any combination of analog and digital audio devices, it’s very simple to measure a USB headset. All you need to do is make sure you have it set up as a hardware device in SoundCheck, and use a compound stimulus and frequency shift step to align your waveforms before analysis. You can measure any other USB connected audio device in the same way. Check out our website to learn more and download the SoundCheck test sequence.

https://www.listeninc.com/wp/media/2026/08/USB-Headset-Demo-TN-scaled.png 1440 2560 Julius Wijono https://www.listeninc.com/wp/media/logo.png Julius Wijono2026-08-19 09:27:542026-08-19 09:32:58USB Headset Measurement

Overcoming Challenges of Measuring Distortion Audibility in Automotive Audio Systems

August 13, 2026/in Automotive Papers, Blog, Papers/by Zarina

Standardized measurement of in-car audio systems remains an ongoing challenge, particularly regarding microphone configuration and placement, test signals, and correlation with perception. Current recommendations from the AES Technical Committee on Automotive Audio (TC-AA) advocate spatial averaging using multi-microphone arrays to improve repeatability.

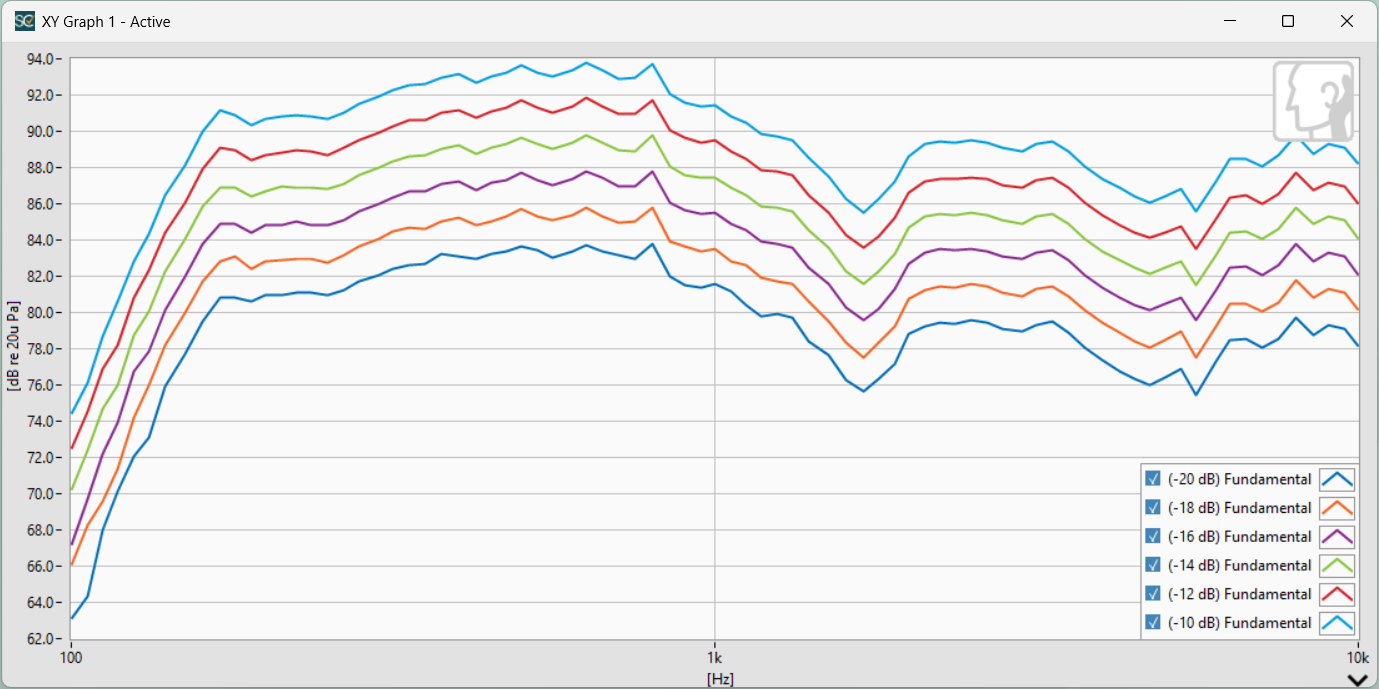
While this method reduces the influence of reflections and standing waves to improve frequency magnitude measurement consistency and repeatability, it limits frequency, phase and amplitude resolution, which help identify the root causes of the distortions and evaluate their perceptual impact. An alternative approach is to apply frequency-normalized distortion analysis, where reflections or standing waves in the frequency response are also echoed in the distortion results, and greatly reduced by direct comparison of the two measurements. In this paper, spatial averaged distortion measurements using the TC-AA recommended 6 microphone array are compared with normalized distortion calculations, and a single microphone capture using the normalized distortion method.

Buzz, Squeak & Rattle (BSR) measurements otherwise known as Rub & Buzz or Impulsive Distortion measurements are also challenging. The TC-AA recommends a crest factor algorithm, available in a few audio measurement systems. This adequately detects transient distortions, but is susceptible to background noise, therefore requires a tightly controlled environment for making measurements. Two other methods, enhanced perceptual Rub & Buzz and enhanced Loose Particles offer improved repeatability in the presence of background noise, and the results are easier to correlate to audibility. The three methods are compared, both in a quiet environment, and with background noise.

Author: Steve Temme, Listen, Inc.
Presented at the AES Automotive Conference (July 2026) Detroit, Michigan

Full Paper

Overview

This paper investigates improved methods for measuring audible distortion in automotive infotainment systems. Traditional Total Harmonic Distortion (THD) measurements are often compromised by vehicle cabin reflections and standing waves, making it difficult to distinguish genuine loudspeaker distortion from acoustic artifacts. The paper demonstrates that Frequency-Normalized Total Harmonic Distortion (nTHD) produces more accurate and perceptually meaningful results than conventional THD, while also reducing measurement complexity and cost.

Key Findings

  • Frequency-normalized THD (nTHD) largely removes the effects of cabin reflections by comparing harmonics with the fundamental at the same measured frequency before calculating distortion.
  • nTHD produces clearer distortion measurements than conventional THD and more accurately identifies the true source of distortion.
    A single microphone using nTHD closely matches measurements obtained from the AES TC-AA recommended six-microphone array, suggesting a practical lower-cost solution for production-line testing.
  • For Buzz, Squeak and Rattle (BSR) measurements, traditional Crest Factor analysis is susceptible to background noise.
    Two alternative techniques—Enhanced Perceptual Rub & Buzz (ePRB) and Enhanced Loose Particles (eLP)—provide better repeatability, improved noise immunity, and stronger correlation with what listeners actually hear.

Why It Matters

Automotive audio systems are measured in highly reflective environments where conventional distortion measurements can misinterpret reflections as loudspeaker defects. Frequency-normalized distortion separates linear acoustic effects from true nonlinear distortion, allowing engineers to identify problems more accurately. The paper also shows that perceptually based distortion measurements better reflect human hearing and remain reliable in noisy environments such as vehicle production facilities.

Applications

The techniques described are particularly valuable for:

  • Automotive infotainment system development
  • End-of-line manufacturing testing
  • Loudspeaker quality assurance
  • Diagnosis of Buzz, Squeak and Rattle (BSR)
  • Production environments requiring faster, lower-cost acoustic measurements

Conclusion

The paper concludes that frequency-normalized THD provides a more accurate representation of audible distortion than conventional THD in vehicle cabins. Combined with perceptually based Rub & Buzz and Loose Particle measurements, it offers improved correlation with listener perception, greater immunity to background noise, and the potential to replace expensive multi-microphone measurement systems with a single microphone for many automotive production applications.


https://www.listeninc.com/wp/media/2026/07/Paper_AES_Automotive.png 776 598 Zarina https://www.listeninc.com/wp/media/logo.png Zarina2026-08-13 15:53:072026-10-01 17:55:32Overcoming Challenges of Measuring Distortion Audibility in Automotive Audio Systems
Page 1 of 31123›»

Audio Measurement Expertise


How Changing Industry Needs are Shaping Audio Test and Measurement

Smarter SoundCheck Sequences with Loops and Logic

Audio Basics: Polarity

How to Measure: Haptics

The Value of Big Data

Audio Basics: Phase Response

view all

Latest News


2026 End Of Year Promotions

Celebrating 30 years: Listening – The Secret Of Our Success

Automotive Test Sequence Including BSR, Max SPL and Frequency Response

Listen Introduces AudioConnect 2, a New Portable Dual-Channel Audio Interface

SoundCheck 21 Brings Enhanced Loose Particle Detection, Multichannel FFT, Metadata, Sequence Protection and more


Audio Measurement Expertise – Delivered Monthly


ABOUT LISTEN INC

Listen is a global leader in audio measurement and analysis, with over 30 years’ experience developing innovative test methods and algorithms. SoundCheck, our powerful software-based audio analyzer, pairs with our test interfaces, precision microphones, and accessories to offer a complete solution for testing loudspeakers, headphones, microphones, smart devices, communication systems, hearing aids, automotive audio, and more. Trusted by engineers worldwide, Listen delivers the accuracy and flexibility essential for modern audio testing, from the R&D lab to the production line.

PRODUCTS
APPLICATIONS
SUPPORT
RESOURCES
NEWS & EVENTS
ABOUT

CONNECT

YouTube
LinkedIn
LinkedIn
Share
Instagram

Copyright © Listen, Inc.   |   Privacy Policy   |   AI Disclosure
  • Instagram
  • LinkedIn
  • Youtube
  • Mail
Scroll to top