Registration required

The content you have requested is available only to registered visitors. Please complete the short form below (all fields are required).

  • 简体中文 简体中文 Chinese (Simplified) zh-hans
  • English English English en
Listen, Inc.
  • Products
    • AUDIO MEASUREMENT
    • System Overview
      • What Soundcheck Measures
      • SoundCheck for R&D
      • SoundCheck for Production
      • Innovation
    • SoundCheck Software
      • Making Measurements
      • Algorithm Highlights
      • Integration
      • What’s New?
      • Packages, Modules & Pricing
      • Support Contracts
    • Audio Measurement Interfaces
      • AudioConnect 2 (2 channel))
      • AmpConnect 621 (6/2 channels)
      • AudioConnect 8×8 (8 channel)
      • AudioConnect 6×2 (6/2 channel)
      • AmpConnect ISC (2 channel)
      • 3rd Party Audio Interfaces
    • Audio Testing Hardware
      • Microphones & Amplifiers
        • Measurement Microphones
        • Microphone Power
        • Audio Test Amplifier
      • Specialist Test Interfaces
        • Bluetooth Audio Measurement Interfaces
        • MEMS microphone Interfaces
        • DC Connect
      • Audio Test Accessories
        • Turntables
        • Halo Automotive 6-Mic Array
        • Automotive Audio Test Kit
        • The SCC-1 Ear Coupler
        • Other Measurement Transducers
        • Impedance Box
        • Calibrators
    • NOISE & VIBRATION MEASUREMENT
    • System Overview
    • NoiseCheck Software
    • Noise & Vibration Interfaces
    • Noise and Vibration Testing Hardware
  • Applications
    • Headphones & Headsets
    • Loudspeakers & Microspeakers
    • Microphones
    • Automotive
    • Communications
    • Smart Devices
    • Hearing Aids
    • Audio Electronics
  • Support
    • Get Support
    • User Documentation
    • Knowledgebase
    • Training
    • Sequences & Resources
    • Drivers
    • Register Product
    • Report a Bug / Request a Feature
  • Resources
    • ‘Sound Matters’ Blog: Audio Measurement Expertise
    • Test Sequences
    • Article Reprints
    • Published Papers
    • Technical Notes
    • Measurement Services
    • Useful References
  • News & Events
    • News
    • Events
  • About Listen
    • Listen, Inc.
    • Contact
    • Distributors & Reps
    • Careers
    • Privacy Policy
  • Menu Menu

Display on Blog Page. This is a secondary category. Should usually also be in a primary category unless it is just intended as a blog post

Automotive Audio Is Accelerating. Are Measurements Keeping Pace?

August 6, 2026/in Blog/by Renee Lucas

I’ve just returned from the AES Automotive Audio Conference in Detroit – an event I always look forward to because it combines two of my favorite passions: cars and audio. With an interesting mix of attendees from automotive OEMs, Tier 1 suppliers, loudspeaker manufacturers,
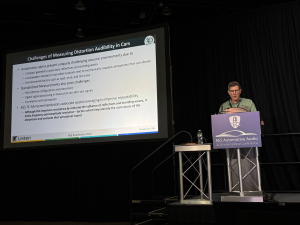
researchers and measurement engineers, it’s a great place to see the latest research and understand where the industry is heading.

As always, the content covered many areas, and after three days of presentations, demonstrations and conversations, I found myself reflecting on just how quickly automotive audio is changing – and how our evaluation methods are struggling to keep pace.

Looking back over the conference, what struck me wasn’t any single technology, but why so much innovation is happening in automotive audio. Electric vehicles have given us something that’s surprisingly rare in consumer audio: a quiet, highly controllable listening environment. Unlike the home, where room acoustics, loudspeaker placement and even the listener’s position are largely unknown, the interior of a vehicle is a carefully engineered space. Every loudspeaker location, reflective surface and listener position is known in advance. In many ways, it’s the ideal environment in which to create a consistent listening experience.

Perhaps that’s why we’re seeing so much innovation. Ten years ago, many of this year’s hot topics – headrest speakers, haptics, immersive audio and personalized sound zones – were little more than research projects. Today they’re finding their way into production vehicles.

One area where is particularly apparent is the growing use of headrest loudspeakers. Just a few years ago they were practically unheard of; today they’re being used for a wide range of applications, from enhancing immersive audio to creating personal sound zones, and also for active noise control.

At the conference, I saw much enthusiasm for the potential these provide, and it is clear that they are here to stay, but there is much less agreement on how they should be measured. Traditional automotive loudspeaker measurements were
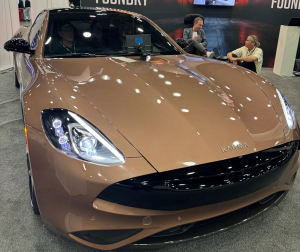
developed for speakers mounted in doors and dashboards, not a few inches from the listener’s ears. Questions about microphone placement, averaging techniques and the interaction with the rest of the vehicle audio system are still very much open for debate. Some have proposed measurement methodologies, but I didn’t see any that were practical, especially for high volume measurement. Furthermore, most manufacturers that I spoke to did not yet have a fully-developed test plan for these products. Until we reach some consensus, comparing measurements between different systems and manufacturers will be difficult – it’s definitely something we need to work on!

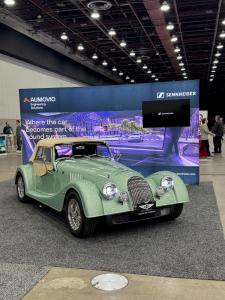
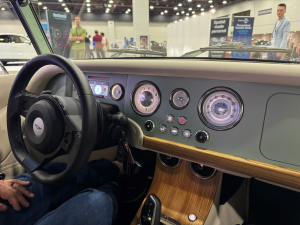
Another trend gathering momentum is haptics. Seat-mounted tactile actuators are becoming increasingly common as a way of enhancing low-frequency reproduction, but one demonstration in particular showed just how far this idea can be taken. Aumovio and Sennheiser demonstrated a Morgan sports car in which not only the seats, but the dashboard itself, became part of the sound reproduction system. I have to admit I was a little skeptical before hearing it, but I came away impressed – the sound quality was far better than I expected from a vibrating dashboard!

This makes me wonder how we’ll evaluate these increasingly complex systems where sound is felt as well as heard. I suspect this will also be a topic of much discussion in the next couple of years.

Another topic that generated a surprising amount of conversation was the sound of electric vehicles. Many manufacturers appear keen to retain an acoustic identity as they transition from gasoline engines to electric vehicles. This has usually involved recreating the signature sound of their internal combustion engine, but there now seems to be growing interest in amplifying or enhancing the natural sounds produced by the electric drivetrain itself to create a new sound signature. I understand the motivation, although personally, one of the things I enjoy most about driving an EV is the absence of engine noise. I’d rather the engineers spent their effort making the cabin quieter and the music sound even better!
Of course, as automotive audio systems become more sophisticated, they’re also becoming more complex. Premium vehicles containing more than 30 loudspeakers and exciters no longer seem unusual – I think one car on display at the conference event had a total of 46! From the customer’s perspective the audio possibilities this presents are exciting. From a manufacturing perspective it presents an entirely different challenge. Every additional transducer, mounting point and trim component represents another opportunity for buzz, squeak, and rattle distortion or assembly defects. This inevitably brings us to a subject very dear to me – distortion.

Despite all the innovation taking place in automotive audio, I was interested to see how often Total Harmonic Distortion (THD) still continues to appear in presentations and product specifications. THD is a well established and often useful audio metric, but inside a vehicle it’s often a
poor predictor of what listeners actually hear. Reflections, multiple sound sources and the acoustic complexity of the cabin make it difficult to relate a conventional THD measurement to perceived sound quality.

That was the subject of the paper I presented at the conference. Rather than relying on traditional THD measurements, I discussed the use of Frequency Normalized Distortion together with perceptual and time-domain distortion metrics that show much better correlation with audible defects while still being practical for production-line testing. I’m not suggesting that we’ve completely solved the problem, but I do think it’s time to move beyond measurements simply because they’re familiar, and take a hard look at what measurements actually reflect what people actually hear.

One thing sadly missing this year was a meeting of the AES Technical Committee on Automotive Audio. That said, it was encouraging to see how widely the committee’s work has already been adopted. The recommended six-microphone array appeared in presentation after presentation, which suggests the industry is converging on a common measurement methodology. The next challenge is making that methodology accessible. Not every engineering team has the budget for a dedicated measurement array, particularly when multiple systems are needed across R&D and production. We used the conference to introduce a new low-cost six-microphone array. By using a 3D-printed design that accepts any standard ¼-inch microphone, we’ve significantly reduced the cost of TC-AA compliant measurements while adding practical features such as snap-in microphone mounts and an integrated bubble level to facilitate alignment. We hope this will remove one of the barriers to wider adoption of the TC-AA methodology.

The irony is that while the listening environment has become more controllable, the measurement problem has become considerably more complex. Consumer loudspeakers are still largely evaluated in anechoic or simulated anechoic conditions because we have no idea where they’ll eventually be used. In a vehicle we know exactly where everything is, but we now have multiple loudspeakers operating simultaneously, strong reflections, listeners sitting close to transducers, structural vibration, and entirely new ways of delivering the listener experience, such as haptics. Developing measurements that are meaningful, repeatable and comparable across different vehicles is one of the biggest challenges facing automotive audio. Reaching consensus on those measurements may prove just as difficult, but the discussions taking place at conferences like AES Automotive are an important step in the right direction.

https://www.listeninc.com/wp/media/2026/08/Linkedin_automotive_article_header.png 1080 1920 Renee Lucas https://www.listeninc.com/wp/media/logo.png Renee Lucas2026-08-06 09:41:582026-08-06 09:41:58Automotive Audio Is Accelerating. Are Measurements Keeping Pace?

Hearing Protection Measurement

June 29, 2026/in Audio Measurement Videos, Blog, Uncategorized/by Julius Wijono

How do you measure hearing protection devices? In this short video, we demonstrate how to measure hearing protection using SoundCheck in accordance with the ANSI S3.19-1974 standard. You’ll see how to set up a head and torso simulator, calibrate the system, and perform repeated unoccluded and occluded measurements using pink noise to accurately calculate attenuation and Noise Reduction Rating (NRR). This method can be used for a wide range of hearing protection devices to ensure reliable and standardized performance testing.

Watch this Video Demo of Measuring Hearing Protection

Learn More about Hearing Protection

    • Measuring Hearing Protection Devices to ANSI S3.19-1974 Standard: https://www.listeninc.com/products/test-sequences/free/noise-cancelling-headphones-test-sequence/

Video Transcript: How to Measure Hearing Protection

In this short video, we’ll measure the performance of hearing protection devices and calculate the Noise Reduction Rating using the ANSI S3.19-standard.

Our setup is simple. We have a head and torso simulator to wear the hearing protectors and capture the signal, a speaker to play the test stimulus, and a calibrated reference microphone for speaker calibration. The stimulus and response signals are transmitted to and from the computer using the AmpConnect 621 audio interface which also contains an amplifier to power the speaker. I also have a SoundConnect 2 to provide 200V polarization voltage to the ears since I’m using an older HATS. The newer versions have pre-polarized ear simulators so they can be powered directly from Listen’s audio interfaces.

We’ll play a pink noise test signal and capture the response with the ears unoccluded. We’ll then put on the hearing protectors and make the occluded measurement. We’ll re-position and re-measure several times and take an average to account for fit variations. We’ll then compare the occluded and unoccluded data to calculate the noise reduction ratio, or NRR.

My reference microphone is already calibrated, and connected to input 1. Now  I need to calibrate the ear simulator input signal paths and source speaker in the calibration editor.

Let’s go to  Setup > Calibration and go to Input Signal paths > Ear Sim L. I have connected this to Input 2, now I’m ready to calibrate the ear. I’m going to use a B&K 4231 calibrator with the coupler UA 1546, hit the calibrate button and save the sensitivity value. Now we’ll repeat that for the other ear, Ear Sim R which is connected to Input 3.. 

Next, I need to calibrate the source speaker. I’ll place the reference mic as close to one side of the hearing protector test fixture as possible. We’ll navigate to the output signal paths tab inside the Calibration editor, and select Source speaker. I’ll make sure it is assigned to Output 3 because that’s the amplifier output of the AmpConnect 621 where we have it connected. Now I’ll click Calibrate using Reference mic as the input. We’ll use a level of 80dBSPL from 10kHz-100Hz, the same frequency range that we’ll use in the sequence. It’s not quite flat, so we’ll iterate a couple more times until the EQ’d response is flat. This looks good. Now, everything is calibrated, we’re ready to run the sequence. 

Let’s hit start.

First, the sequence wants to know how many trials I want to do. We’re going to make this measurement several times, removing the DUT and placing it back so that we can average the response to account for fit variation. We’ll run it 5 times for the purposes of this demo.

First, we’ll capture the unoccluded response – this means measuring the sound levels without any hearing protection in place. The test sequence will play pink noise through the speaker and record the sound spectrum at both ears of the fixture. Let’s hit enter.

Let’s save this measurement.

Now the sequence is asking me to place the hearing protection device onto the test fixture and we’ll continue to repeat the test to measure the occluded response. Now we’ll just follow the instructions and do it four more times.

Next, the sequence performs postprocessing steps on these unoccluded and occluded measurements to calculate the attenuation at different frequencies, average attenuation, standard deviation and finally the Noise Reduction Rating (NRR) – you can see its 26.6 on the left and 32.1 on the right. These measurements provide a complete picture of the device’s performance. 

And that’s it! Using this pre-written sequence – which you can download from our website – it’s quick and easy to  accurately measure attenuation and determine the Noise Reduction Rating of any hearing protection device to the ANSI standard.

https://www.listeninc.com/wp/media/2026/04/Hearing-Protection-TN-scaled.png 1440 2560 Julius Wijono https://www.listeninc.com/wp/media/logo.png Julius Wijono2026-06-29 07:00:512026-08-28 09:00:18Hearing Protection Measurement

Headphone Distortion Audibility: Subjective Perception and Psychoacoustic Measurements

May 4, 2026/in Blog/by Julius Wijono

Last week, 2 of the world’s leading distortion experts –  Steve Temme and Dr. Sean Olive – shared a stage at the Bay Area AES Chapter meeting for a deep dive into headphone distortion audibility, bridging the gap between objective measurement and subjective perception.

We had several requests to record it, so here it is! We made the decision to record at the last minute using an iPhone and a couple of hastily procured wireless lapel mics, so it’s not the best quality recording in the world – maybe that’s an incentive to join in person next time!

This unique event is a rare opportunity to see measurement science and listening experience examined side by side, providing a more complete understanding of what distortion really means in modern headphones.

Sean Olive presents research on the perception and measurement of nonlinear distortion in headphones, exploring thresholds of audibility using real music and multiple measurement techniques. His findings challenge common assumptions, showing that distortion becomes audible at playback levels significantly higher than typical listening conditions—and highlighting what this means for future headphone design and evaluation.

Steve Temme approaches distortion from a psychoacoustic perspective, explaining how we perceive it, why traditional metrics can fall short, and how methods like Normalized THD better align with human hearing. He also examines the trade-offs introduced by active noise cancellation, demonstrating how reducing one type of distortion can unintentionally impact perceived sound quality.


Watch the video here:

https://www.listeninc.com/wp/media/2026/05/steve_sean-1.png 833 1324 Julius Wijono https://www.listeninc.com/wp/media/logo.png Julius Wijono2026-05-04 17:24:032026-08-28 14:38:19Headphone Distortion Audibility: Subjective Perception and Psychoacoustic Measurements

Hearing Aid Measurement

April 29, 2026/in Audio Measurement Videos, Blog, Hearing Aid Videos/by Julius Wijono

How do you measure hearing aids? In this short video, we demonstrate how to test hearing aids using SoundCheck with standard ANSI S3.22 measurement techniques. You’ll see how to set up an anechoic test box and coupler, and configure SoundCheck for key measurements including frequency response, input/output linearity, OSPL 90, and release time. This method can be used to accurately evaluate hearing aid performance and ensure compliance with industry standards.

Watch this Video Demo of Measuring Hearing Aids

Learn More about Hearing Aids

    • Hearing Aid Input vs Output Test Sequence: https://www.listeninc.com/resources/test-sequences/hearing-aid-input-vs-output-test-sequence/

Video Transcript: How to Measure Hearing Aids

Today,  I’ll demonstrate a hearing aid measurement using SoundCheck with some of our standard hearing aid test sequences. We’ll use some of the tests outlined in the ANSI S.22 hearing aid test standard – frequency response, input/output linearity, OSPL 90, and release time. 

First let’s take a look at our hardware setup.

It’s a little more involved than something like a loudspeaker measurement because hearing aids have some unique test requirements. For a start, we need an anechoic test box  – this one’s a B&K 4232 but you could use anything similar. It has a speaker integrated inside, which we’ll play our test signal out of. We’ll put our hearing aid in this coupler with a ½” pressure microphone. We also have a SCM reference free-field microphone which is also going to go in the test box. The ½” mic needs LEMO power, so it’s connected to a SoundConnect 2 power supply, and the mic input then goes into the AmpConnect 621 Audio Interface. The AmpConnect also provides power for the SCM mic and amplification for the speaker in the test box. 

If I were running the complete suite of ANSI S.22 tests, I would also need a DC power supply and current monitor but since the tests we’re running today don’t require voltage regulation or current monitoring, we’ll just power the hearing aid from its internal battery.  

I’ve already calibrated the source speaker located inside the test box using my SCM reference microphone pointed at the source speaker.  The coupler is configured with a ½” microphone capsule, and we’ll attach our hearing aid to the coupler’s input – we have some tack in here to get a good seal. Now we’ll put it in the test box so its microphone port is located at the same position I had the reference microphone.  Let’s close the box, and we’re ready to test.

Let’s start with Frequency Response. The hearing aid should be set to its reference test gain. We’ll play an equalized stepped sine sweep from 10 kHz – 100 Hz at a level of 60 dBSPL through the test box speaker, and analyze the output of the hearing aid with the Heterodyne algorithm to produce a frequency response. Next, the HFA,  or High Frequency Average is calculated by averaging the response values at three frequencies – 1000, 1600, and 2500 Hz. We then subtract 20dB from the HFA, and two post processing steps are used to find the upper and lower frequency points at which the response curve intersects the HFA -20 value. These are the high and low frequency cutoff points. Limits can be applied to all of the curves and values of this sequence. Let’s run it.

And here you see the Fundamental curve falls outside of the upper and lower limits at a few frequency points, the low frequency cutoff is 217 Hz and the high frequency cutoff is a little over 5 kHz.

Our next test is input/output linearity. We’ll leave the hearing aid at reference test gain, and use an amplitude sweep from 50-90 dBSPL played through the test box speaker. This is repeated at four frequencies (1 kHz – 4 kHz) in 1 kHz increments, and the output of the hearing aid is plotted vs. the input on the graph. This test is useful for characterizing any automatic gain control or compressor in the hearing aid,  and is used to attenuate the hearing aid’s output above a certain level so as to not further damage the user’s hearing. Let’s run it.

The effect of the automatic gain control is clearly visible at all four frequencies.  The x-axis represents the stimulus level and the y-axis the output level from the hearing aid.  We can see that the gain limiting kicks in when the input is in the 60-75 dB range, depending on the frequency and note how the overall level of the 4 kHz curve is 10 dB lower than the others because the frequency response of the hearing aid is around 10 dB lower at that frequency relative to the others.

The OSPL 90 test measures the hearing aid’s performance with an input signal of 90 dBSPL.  For this test we need to set the hearing aid gain to its maximum. An equalized stepped sine sweep from 8 kHz – 200 Hz is played at a level of 90 dBSPL, and a broadband rms response curve which includes harmonics as specified in the standard, is analyzed from the recorded time waveform of the hearing aid’s output. Next, the HFA (High Frequency Average) is calculated by averaging the values at three frequencies (1000, 1600, 2500 Hz), and the Max OSPL is calculated by finding the maximum point on the broadband response curve. Let’s take a look.

The OSPL-90 curve looks much like the frequency response curve from our earlier measurement and considering that the input to the hearing aid is a calibrated sweep at 90 dB, the amount of gain in our measurement is between 25 and 40 dB across most of the sweep range. The high frequency average from this measurement is 126.7 dB and the maximum value on the curve is 129.7 dB.

Lastly we’re going to measure the release time of the hearing aid. Again, we want the gain set to max, and we’ll play a  2 kHz sine tone at 90 dBSPL for 1 second, then immediately drop it to 55 dBSPL for 2 more seconds. A band limited time envelope to improve the measurement signal to noise ratio – from 1.5-2.5 kHz –  is calculated and then run through a post processing step, to calculate the release time – that’s the time the coupler SPL remains within 4 dB of the steady value for the 55-dB input. [run test]

Here we can see that the hearing aid output initially drops down to around 85 dB but after 45 ms the release time has stabilized and the hearing aid maintains a steady output level of 115 dB.

So that’s four quick examples of tests from the ANSI S.22 hearing aid standard. Of course, once you have the equipment for these, there are many other hearing aid tests that you can run using the same test setup, and you can configure tests for the complete ANSI S.22 standard in SoundCheck. In fact we’ve already done it, and we sell the test sequence package with all 20 measurements as an add-on to SoundCheck so you don’t even have to program it yourself! Please contact us to learn more.

https://www.listeninc.com/wp/media/2026/04/Hearing-Aids-TN-1080p.png 1080 1920 Julius Wijono https://www.listeninc.com/wp/media/logo.png Julius Wijono2026-04-29 16:09:242026-08-28 14:35:48Hearing Aid Measurement

Open Loop Test Measurement

March 11, 2026/in Blog, Product Demo Videos, Uncategorized/by Julius Wijono

How do you measure devices that can’t be directly connected to an audio interface? In this video, we demonstrate how to measure open loop devices such as smartphones and smart speakers using SoundCheck. You’ll learn how to generate a stimulus file, play it back from the device under test, and use triggered recording with a microphone and audio interface to capture the response for analysis. This flexible technique allows accurate measurement of frequency response, distortion, THD, and Rub & Buzz – even when playback and recording are asynchronous.

Watch this Video Demo of Open Loop Testing

Learn More about Open Loop

  • Open Loop Microphone Test: https://www.listeninc.com/open-loop-microphone-test-updatedtest/
  • Open Loop Measurements of Smart Devices: https://www.listeninc.com/trigger-options-for-open-loop-testing/
  • Trigger Options for Open Loop Testing: https://www.listeninc.com/trigger-options-for-open-loop-testing/

Video Transcript: How to Measure Open Loop Devices

Devices like smartphones and smart speakers can be challenging to test as they can’t be directly connected to conventional interfaces to make audio measurements. This means playback and recording are asynchronous.

To make accurate measurements, we use a technique called open loop testing. This lets us manually load the stimulus signal onto the device and play it using a  triggered record. This means SoundCheck starts recording the response once it hears a certain sound. This might be a level threshold, or a specific frequency, or even a chirp. Once it hears that trigger it will begin the acquisition, record the stimulus, and then analyze it as normal. 

Let’s take a look. I’m going to use a standard test sequence that comes with SoundCheck, but first let’s look at our test configuration.

We’re using SoundCheck to create the stimulus file, and we’ll load that manually onto our device – you can send it by email or download via the cloud, or even store it in the device firmware. We’ll then run the sequence, and play the test signal from the phone. When the trigger tone is detected, the software will start recording using an SCM microphone which is connected to the software via an AudioConnect 2 audio interface, and analyze the response.

Let’s go ahead and run the test.

The sequence is giving me the option to create the stimulus files ready to load onto the device, but I’ve already done that so I’ll just decline and let the sequence continue….

Now it’s listening for the trigger. I’ll play the sound…. And you can see, it went ahead and captured the response – we have our recorded time waveform here. Over here we have our fundamental, and also the second and third harmonics. Down here we have THD and Rub & Buzz, and over here we have perceptual Rub & Buzz. You can see we’ve got some distortion across the spectrum, and some Rub & Buzz at low frequencies – that’s not really a surprise – phone speakers tend to be small and inexpensive so these issues are common. Once you have the waveform captured you can run any analysis or calculation on it, so if you wanted, you could add other measurements to this test.

Now that we’ve seen it in action, let’s go back to the sequence and learn a bit more about triggered recording. We’ll start with the stimulus.

As you see, we still have a standard stimulus step from XHz to YkHz,  but when we look at it closer we can see that it has two sections. First we have a frequency log chirp that tells SoundCheck when to start recording. This is much more robust than simple level or tone triggers, especially if you’re in a production environment where you might have background noise or even pick up test tones from other lines. And you can see here we’ve set it so that this portion of the stimulus does not get analyzed. 

The second portion of the stimulus is our test signal – a standard frequency stepped sweep from 10kHz down to 100Hz and we have ‘analyze’ set to ‘yes’ for that one.

The acquisition step must also be configured for triggered record. Here, we make sure the ‘triggered record’ checkbox is checked, and then select the type of trigger that we’re using. We  used ‘level and cross-correlation’, which looks for the specific chirp that we used – that one is the most robust but we also offer simpler level and frequency triggers.

So, as you can see, open loop measurements are simple with SoundCheck. This method can be applied to any device that doesn’t have a direct connection like smart speakers, smart glasses, phones or even robots. Check out our website to learn more.

https://www.listeninc.com/wp/media/2026/03/Open-Loop-Demo-TN-scaled.png 1440 2560 Julius Wijono https://www.listeninc.com/wp/media/logo.png Julius Wijono2026-03-11 15:53:332026-08-28 14:29:19Open Loop Test Measurement

Frequency Normalized Distortion – A Necessity for Modern Transducers

February 20, 2026/in Algorithm Article Reprints, Article Reprints, Blog/by Zarina

Normalized THD articleFrequency Normalized Distortion, or Normalized THD is a more accurate method for measuring distortion in transducers, and should be used alongside conventional THD measurements. Here’s the background from the creator of the original measurement.

Full Article

More about Frequency Normalized THD

This article examines the limitations of conventional Total Harmonic Distortion (THD) calculations when evaluating modern acoustic transducers. Conventional THD shifts harmonics and compares them to the fundamental at the stimulus frequency. This combines the device’s linear and non-linear distortion, often resulting in an overestimation of low-frequency distortion and an underestimation of high-frequency distortion due to normal passband roll-offs.

To accurately isolate true non-linear mechanisms, Frequency Normalized Distortion compares harmonics to the fundamental at their actual measured frequencies. By reversing the calculation order, this method successfully removes the influence of both the linear frequency response and room reflections.

This normalized approach is especially critical for evaluating piezo-MEMS speakers. These silicon-based devices behave very linearly in the lower frequencies, but their sensitivity increases with frequency. Consequently, standard THD equations sometimes can conflate their rising linear acoustic output with non-linear distortion which can result in trying to design around nonlinearities that don’t exist.

Full Article

https://www.listeninc.com/wp/media/2026/02/Frequency_normalized_distortion_AX_March-2026-cover.jpg 396 300 Zarina https://www.listeninc.com/wp/media/logo.png Zarina2026-02-20 11:00:272026-02-20 11:00:57Frequency Normalized Distortion – A Necessity for Modern Transducers

7 Key Automotive Audio Measurements You Can Make with SoundCheck

February 18, 2026/in Blog/by Julius Wijono

Car audio is complex, but measuring it doesn’t have to be! SoundCheck measures a range of automotive infotainment parameters from simple frequency response to complex communications measurements. These include:


Frequency response. Frequency response is the clearest indicator of overall audio system performance. We recommend evaluating it according to TC-AA recommendations using 80dBA monophonic, correlated pink noise on both left and right input channels on the head unit. SoundCheck also supports the use of uncorrelated pink noise, which may yield additional useful information.

Seat-to-Seat Spectral Uniformity. Ideally, each passenger in the car experiences the same high-quality sound performance from the infotainment system. However, it is extremely difficult to independently equalize the loudspeaker playback system for each seat in the car. Trade-offs are made in the infotainment system tuning, typically favoring the driver’s seat. This results in the frequency response in the other seats being less smooth or ideal. SoundCheck measures the frequency response in each seat, then compares it to the driver’s seat to identify the seats with the greatest differences. 

Total Harmonic Distortion (THD). THD is a valuable measurement which indicates the overall non-linear performance of the device; a measurement outside the limits may indicate a poorly centered voice coil, or mechanical defects. SoundCheck measures THD using both conventional and frequency-normalized methods. Frequency-normalized distortion offers greater insight to what is causing distortion  for in-car measurements where there are many reflections.

Intermodulation Distortion. Intermodulation distortion is useful for evaluating multi-way speaker systems with a crossover. Intermodulation distortion can be observed when a small driver is trying to play back low and high frequencies simultaneously. Measurements are made using a two-tone stimulus with a fixed tone set to 50Hz and a sweeping tone from 20kHz to 150Hz, and responses are power-averaged prior to display.

Maximum SPL. Maximum SPL makes it easy to compare the maximum volume of an infotainment system in a car. It is the maximum sound pressure level that a car’s infotainment system can reproduce inside the cabin with its windows, sunroof, and convertible top closed, and it combines all the components of the system – speakers, amplifiers, power supply, etc. SoundCheck measures both the overall Maximum SPL and also the Max SPL spectrum, displaying them simultaneously.

Max SPL versus Frequency for a given percentage distortion. While Maximum SPL is the commonly specified measurement, it’s important that the audio system sounds good when it’s played loudly – this makes Maximum SPL at the onset of audible distortion an important metric. While time-consuming and manual with some test systems, SoundCheck’s conditional looping makes it easy to configure and automate. For each measured frequency, the tone-burst stimulus is played multiple times, increasing the level in 3dB steps until the THD exceeds, for example, 10%. The level is then reduced by 3dB and increased in smaller increments of 0.5 dB to more precisely find the 10% THD threshold. The Max SPL is recorded at that frequency and the test sequence continues to the next frequency. Although time consuming, the entire process is completely automated via the test sequence to minimize human interaction.

Impulsive Distortion. Buzz, Squeak, and Rattle (BSR) caused by vibrating door panels, loose wire harnesses, fasteners, etc. degrades the listener experience. Impulsive distortion can be used to measure this, and also serves as a useful measurement to make before  performing system characterization measurements to ensure the infotainment system is correctly installed in the vehicle under test. SoundCheck offers three different impulsive distortion metrics: Crest Factor, enhanced Perceptual Rub & Buzz (ePRB), and enhanced Loose Particle detection (eLP). While Crest Factor is suggested by the AES Technical Committee on Automotive Audio (TC-AA), ePRB results correlate better to human audibility and provide increased reliability in noisy environments. SoundCheck’s eLP algorithm records individual transient distortion events versus time which reveals any loose particles or rattling wires in the car with greater precision.

Additional Resources

Automotive Audio Measurements AudioXpress Article

Standardized Automotive Audio Testing Seminar

https://www.listeninc.com/wp/media/2024/07/AES_automotive_in_car-scaled.jpg 2560 1920 Julius Wijono https://www.listeninc.com/wp/media/logo.png Julius Wijono2026-02-18 17:16:562026-02-19 11:09:367 Key Automotive Audio Measurements You Can Make with SoundCheck

Frequency Normalized Distortion Seminar

February 10, 2026/in Blog, Seminar Recordings/by Julius Wijono

Recent transducer development, particularly piezo-MEMS loudspeakers, have brought renewed attention to Normalized Distortion (also known as Frequency Normalized Distortion), because it is essential to accurately characterize their behavior.

Normalized Distortion is a measurement algorithm first proposed in a 1993 AES paper by Listen president Steve Temme during his time at Brüel & Kjær. Although it has been available in SoundCheck since 1996 and used by some engineers for nearly 30 years, interest in the technique has surged recently. This renewed focus is driven both by the industry’s increasing emphasis on correlating measurements with audibility – an area Listen has long prioritized – and by the emergence of new microspeaker technologies that cannot be fully evaluated using conventional distortion measurements.

In this seminar, we’ll first explain distortion mechanisms and talk about correlating measured results to what we hear using masking curves. We’ll then examine how normalized distortion differs from the conventional approach and show why it’s essential for characterizing modern piezo-MEMS loudspeakers.

This seminar presentation includes:

  • Psychoacoustics
  • Even Order Distortion
  • Odd Order Distortion
  • Threshold of Hearing
  • Auditory Tonal Masking
  • Masking vs. Level
  • Masking vs. Frequency
  • Masking of High Order Harmonics
  • Real-Time Masking Curves
  • Linear vs Nonlinear Effects
  • Plotting Harmonic Curves
  • Dynamic Speaker Normalized THD Measurements
  • Conventional Dynamic vs. MEMS Speaker
  • MEMS Speaker Measurement Test Configuration
  • Piezo-MEMS Speaker Conventional THD Measurements
  • Piezo-MEMS Speaker Normalized THD Measurements

Presenter: Steve Temme
Duration: 30 Mins

Frequency Normalized Distortion Resources

How to Graph Distortion Measurements: Original 1993 paper where normalized THD was introduced.

The Value of Normalized Distortion: Blog post on the value of normalized distortion.

MEMS Speaker Measurements: 100 Things video on MEMS speaker measurements.

Smart Glasses Audio Measurement: A video demo on how to measure smart glasses audio.

https://www.listeninc.com/wp/media/2026/02/Measuring-Distortion-Intro.png 1080 1920 Julius Wijono https://www.listeninc.com/wp/media/logo.png Julius Wijono2026-02-10 17:39:552026-08-21 12:41:59Frequency Normalized Distortion Seminar

How to Average Data in SoundCheck

January 6, 2026/in Blog, SoundCheck Tips Videos/by Julius Wijono

Learn how to average measurement data the right way in SoundCheck. In this video, we’ll walk through curve averaging, averaging multiple curves, and waveform RMS calculations to get meaningful results from your data.

Additional Resources for SoundCheck

Detailed explanations of how to use SoundCheck can be found in the SoundCheck manual.

Video Transcript: How to Average Data in SoundCheck

There are several ways we can average data in SoundCheck. The sequence step that you use depends on your input data and what you’re actually trying to get out of it. Let’s look at some examples.

First, let’s find the average of a single curve. We can do this using a post-processing curve average step. Here, my input is curve one. My operation is average. And when I output this value, it’ll give me the average value of all of the magnitude values from my curve as the Y axis, and also the average phase data as the Z axis on the value.

Now let’s find the average of a number of curves. We use this all the time, for example finding the power average of multiple microphones in an array. Here I have eight different curves and I want to find the average not of one but of all eight. Instead of a curve average step here, I’ll use an average curve step. First, I need to put all these curves into a group. I’ll just call it curves. And then in this post-processing step, I’ll choose the group that I’m interested in, which could be either curves or waveforms, and the averaging type. I have the option of complex, which will include phase data, or power, which won’t. I’ll use power for now. Rather than outputting a single value like we had before, this generates a curve that’s the average of all of my curves. And I can even put this on my display. And you’ll see that this curve here, the average curve, is now on my graph alongside the other curves.

We can also average waveform data. Here I have a one volt RMS sine tone. I might want to know what the average of this is here. If we use a curve average step, because this is a waveform and there’s positive and negative data, the average is going to be about zero, which isn’t very interesting to me. Instead, we could use the waveform RMS step. I can input my waveform. And this gives me an output of one volt RMS, which is as expected since that’s what I have set for my waveform here.

So that’s 3 easy ways we can find averages in SoundCheck. Check the manual for more details.

https://www.listeninc.com/wp/media/2026/01/Average-Data-Blog-TN.png 1080 1080 Julius Wijono https://www.listeninc.com/wp/media/logo.png Julius Wijono2026-01-06 05:00:152026-08-27 13:59:38How to Average Data in SoundCheck

SoundCheck’s FFT Analyzer and RTA: Live or in a Sequence

December 23, 2025/in Blog, SoundCheck Tips Videos/by Julius Wijono

Understand when to use SoundCheck’s FFT Analyzer and RTA live versus in a sequence. In this video, we’ll show how live multi-instrument FFT/RTA measurements are ideal for real-time adjustments and troubleshooting, while sequence-based analysis steps enable automated, repeatable measurements, averaging over time, and advanced calculations like frequency response.

Additional Resources for SoundCheck

Detailed explanations of how to use SoundCheck can be found in the SoundCheck manual.

Video Transcript: SoundCheck’s FFT Analyzer and RTA: Live or in a Sequence

In SoundCheck, you can run an FFT or an RTA either live via the multi-instrument or through the analysis step in a sequence. 

Let’s outline the differences.

Taking an FFT or an RTA via the multi-instrument is always an input-only measurement and it displays the live curves and changes over here in the graph. So, as I’m talking, you’ll see that these are displaying the current measurement on my reference microphone. This is very helpful for live adjustments – for example if I’m changing the DSP on a device and I want to see how it behaves, or checking the seal on some headphones. When you’re looking at it live, you can change settings on the fly, so using these controls I can see what happens if I switch from average to max hold, min, or change the windowing or weighting directly in the instrument. Most of this can be done in the analysis step as well, but you might have to rerun the acquisition or open an editor and click apply before you’re able to see the results, whereas here you can see the changes instantly. 

The instrument is also very helpful for troubleshooting. If something is wrong with a measurement,you can just open up an FFT or an RTA to troubleshoot what’s happening and then solve it.

If we instead look at the FFT and RTA in a sequence, I can use an acquisition step  set  to record only. I can then run that reference microphone recording through an FFT spectrum analysis step and an RTA spectrum analysis step to get the FFT and RTA spectrum response for my reference mic. Instead of seeing live changes, I can define the full time length I’m recording and then average across that full recording. This is useful if you want to test something over a set number of seconds and just see the total average there without any additional user interaction. It’s much easier to automate.

There are some calculations we can do in the live multi-instrument. For example, I can look at the power average of multiple inputs and do some basic operations like subtraction and addition. One of the options we have here that’s exclusive to the live multi-instrument is a masking curve. I can play a signal here, add a masking curve, and I can then quickly see what parts of my spectrum are being masked by a dominant tone. That’s only available in the live multi-instrument.

Virtual instruments can be added to sequences in an acquisition step. When used this way, both the instrument and analysis steps output the curves to the memory list of the sequence once the step is complete. Post processing, limits, or statistics can be used for further calculations on the measurements.

There are two common use cases where an analysis step would be required rather than using the virtual instrument: Using previously recorded waveforms and measuring a frequency response.

For example, if I have wave file recordings from a past measurement, or an open-loop test, I can recall those and add them directly into an analysis step. 

We also use an RTA analysis step to measure the frequency response of a device under test. The virtual instrument only calculates an RTA Spectrum of the input signal path, but the analysis is able to calculate spectra for both the Stimulus and Analysis waveforms. This then allows a frequency response calculation. The FFT analysis step will only measure a spectrum for the response waveform, but using the Transfer Function analysis step you can perform complex FFT on the stimulus and response waveform to output a frequency response.

https://www.listeninc.com/wp/media/2025/12/FFT-Analyzer-and-RTA-Blog-TN.png 1080 1080 Julius Wijono https://www.listeninc.com/wp/media/logo.png Julius Wijono2025-12-23 05:00:172026-08-27 13:49:53SoundCheck’s FFT Analyzer and RTA: Live or in a Sequence
Page 2 of 26‹1234›»

Audio Measurement Expertise


How Changing Industry Needs are Shaping Audio Test and Measurement

Smarter SoundCheck Sequences with Loops and Logic

Audio Basics: Polarity

How to Measure: Haptics

The Value of Big Data

Audio Basics: Phase Response

view all

Latest News


2026 End Of Year Promotions

Celebrating 30 years: Listening – The Secret Of Our Success

Automotive Test Sequence Including BSR, Max SPL and Frequency Response

Listen Introduces AudioConnect 2, a New Portable Dual-Channel Audio Interface

SoundCheck 21 Brings Enhanced Loose Particle Detection, Multichannel FFT, Metadata, Sequence Protection and more


Audio Measurement Expertise – Delivered Monthly


ABOUT LISTEN INC

Listen is a global leader in audio measurement and analysis, with over 30 years’ experience developing innovative test methods and algorithms. SoundCheck, our powerful software-based audio analyzer, pairs with our test interfaces, precision microphones, and accessories to offer a complete solution for testing loudspeakers, headphones, microphones, smart devices, communication systems, hearing aids, automotive audio, and more. Trusted by engineers worldwide, Listen delivers the accuracy and flexibility essential for modern audio testing, from the R&D lab to the production line.

PRODUCTS
APPLICATIONS
SUPPORT
RESOURCES
NEWS & EVENTS
ABOUT

CONNECT

YouTube
LinkedIn
LinkedIn
Share
Instagram

Copyright © Listen, Inc.   |   Privacy Policy   |   AI Disclosure
  • Instagram
  • LinkedIn
  • Youtube
  • Mail
Scroll to top