Registration required

The content you have requested is available only to registered visitors. Please complete the short form below (all fields are required).

  • 简体中文 简体中文 Chinese (Simplified) zh-hans
  • English English English en
Listen, Inc.
  • Products
    • AUDIO MEASUREMENT
    • System Overview
      • What Soundcheck Measures
      • SoundCheck for R&D
      • SoundCheck for Production
      • Innovation
    • SoundCheck Software
      • Making Measurements
      • Algorithm Highlights
      • Integration
      • What’s New?
      • Packages, Modules & Pricing
      • Support Contracts
    • Audio Measurement Interfaces
      • AudioConnect 2 (2 channel))
      • AmpConnect 621 (6/2 channels)
      • AudioConnect 8×8 (8 channel)
      • AudioConnect 6×2 (6/2 channel)
      • AmpConnect ISC (2 channel)
      • 3rd Party Audio Interfaces
    • Audio Testing Hardware
      • Microphones & Amplifiers
        • Measurement Microphones
        • Microphone Power
        • Audio Test Amplifier
      • Specialist Test Interfaces
        • Bluetooth Audio Measurement Interfaces
        • MEMS microphone Interfaces
        • DC Connect
      • Audio Test Accessories
        • Turntables
        • Halo Automotive 6-Mic Array
        • Automotive Audio Test Kit
        • The SCC-1 Ear Coupler
        • Other Measurement Transducers
        • Impedance Box
        • Calibrators
    • NOISE & VIBRATION MEASUREMENT
    • System Overview
    • NoiseCheck Software
    • Noise & Vibration Interfaces
    • Noise and Vibration Testing Hardware
  • Applications
    • Headphones & Headsets
    • Loudspeakers & Microspeakers
    • Microphones
    • Automotive
    • Communications
    • Smart Devices
    • Hearing Aids
    • Audio Electronics
  • Support
    • Get Support
    • User Documentation
    • Knowledgebase
    • Training
    • Sequences & Resources
    • Drivers
    • Register Product
    • Report a Bug / Request a Feature
  • Resources
    • ‘Sound Matters’ Blog: Audio Measurement Expertise
    • Test Sequences
    • Article Reprints
    • Published Papers
    • Technical Notes
    • Measurement Services
    • Useful References
  • News & Events
    • News
    • Events
  • About Listen
    • Listen, Inc.
    • Contact
    • Distributors & Reps
    • Careers
    • Privacy Policy
  • Menu Menu

Display on Blog Page. This is a secondary category. Should usually also be in a primary category unless it is just intended as a blog post

Smart Glasses Audio Measurement

September 9, 2025/in Audio Measurement Videos, Blog, Smart Device Videos/by Julius Wijono

How do you measure smart glasses audio? In this video, we demonstrate how to test smart glasses using SoundCheck with a head and torso simulator and Bluetooth interface. You’ll see how to measure speaker frequency response, total harmonic distortion (THD), and left/right balance, as well as how to evaluate the built-in microphone using hands-free profile (HFP) measurements. This simple method can be applied to smart glasses, AR/VR headsets, or any Bluetooth device with speakers and microphones.

Watch this Video Demo of Measuring Smart Glasses Audio

Learn More about How to Perform Smart Glasses Sequences

  • Smart Glasses Speaker Output Test Sequence: https://www.listeninc.com/products/test-sequences/free/smart-glasses-speaker-output-test/
  • Smart Glasses Mic Input Test Sequence: https://www.listeninc.com/products/test-sequences/free/smart-glasses-mic-input-test/

Video Transcript: How to Measure Smart Glasses

It’s easy to make audio measurements on smart glasses using SoundCheck. Let me show you how.  As you probably know, most smart glasses and VR/AR headsets contain small speakers, usually embedded in the arms close to the ears. They also have microphones also hidden in the frames. This means we can make audio measurements on smart glasses pretty much the same way we do with a Bluetooth headset. 

Let’s start with our setup. You need a head and torso simulator, or at least a test head. This lets you position the glasses as they would be worn in real life, and record the sound at the ears. If you want to measure the microphone as well as the speakers, you’ll need one that includes a mouth. Alongside this, we’ll use an AmpConnect 621 audio interface. This transmits the signal from the microphones into the laptop, which is running SoundCheck, and it also provides amplifier output to power the HATS mouth. We’re also going to need a SoundConnect 2 microphone power supply because I’m using an older HATS that needs 200 Volts polarization power. If you have a newer version you can power it directly from the 621. And I’m going to use a BQC bluetooth interface to communicate with the smart glasses.

We’ll use two basic test sequences that you can download from our website. Let’s run the sequence and take a look at the results, then I’ll explain what we’re doing.

First the sequence is prompting me to pair my device. I’ll put it in pairing mode and say ‘yes’.

We can see it in the list here…

Now it’s telling me to put the smart glasses on the head and torso simulator… lets do that

And we’re ready to make our measurement so I’ll hit enter to continue

That was the test signal, a Stweep, which is a special type of stepped sine wave.

Now we can see our results. On the top graphs we have the left and right frequency response – you can see they are pretty well matched. The response is rolling off quite a bit in the low end, so anything below about 500Hz in all of these measurements will be very noisy.

Here we have the total harmonic distortion of both the left and right speakers..

And down here at the bottom we have the left/right balance which you can see is pretty flat up to about 8kHz. Above this, we see some discrepancy as the responses of both ears have more peaks and dips.. This is very sensitive to positioning, so it’s important to make sure the glasses are correctly positioned on the head. It’s also good to make multiple measurements, completely removing and replacing the glasses to see how the balance changes.

Now let’s take a look at the sequence and I’ll show you what we did.

We start with our stimulus step, which is configured to sweep from 20kHz to 100Hz. Then we have some message steps – that’s where it was prompting us if we wanted to pair the glasses using Bluetooth and confirm once it was paired and placed on HATS. Then you can see we play the stimulus and record the response.

Now we have some post-processing going on. Because the Bluetooth output and AmpConnect input don’t use the same master clock for sampling,  we have to resample and frequency shift so that the stimulus and response are aligned for analysis. I’m not sure if you heard the short tone at the beginning of the test signal –  that was a ‘trigger tone’ that lets SoundCheck precisely align the waveforms by playing a signal within the pass band of the device. Once we’ve done this, we can run our Harmonictrak analysis to calculate frequency response and distortion, and also another post-processing step to calculate the left/right balance. Finally, we have a display step that shows all these results on screen.

These smart glasses also feature a microphone for making calls and recording, so let’s now measure that. We’ll use exactly the same setup with a different sequence. This time we’re going to play the stimulus from the mouth, and capture the recording using the microphone.

Let’s run the test… 

We’re pairing it again and we’re switching the Bluetooth profile to HFP – hands-free profile as this is what you’d typically use for making calls. We made the speaker measurement using the A2DP profile as that’s what you would typically use listening to music.

Now it’s going to play the test signal… and output the frequency response… and we can see it’s pretty uniform  from about 300 Hz to about 7k or so,   then it rolls off.

Let’s look at the sequence to see what we did here. 

Here we have our stimulus, sweeping from 8kHz down to 100Hz, which aligns with the HFP Bluetooth profile that we’re using for this measurement.

We have our message steps, the same as before, to connect via Bluetooth 

And here we have our stimulus and acquisition step, you can see we’re playing out the mouth simulator.

And after we’ve done our frequency shift and resampling, we calculate the frequency response of the microphone  and display that on the graph.

So, as you can see, testing smart glasses using SoundCheck is quick and easy – just a couple of minutes to run the tests. And these are pretty basic tests – if you want more extensive measurements you can simply modify the sequence to add any other results that you want. With a little extra equipment, you could also make measurements with background noise, or make audio leakage measurements. You can download these test sequences for free on our website, and they’ll work with any bluetooth device with a speaker and microphone so not just smart glasses but headsets, VR and AR goggles etc.. Check it out, and call us if you have any questions.

https://www.listeninc.com/wp/media/2025/09/Smart-Glasses-Demo-TN.png 1080 1920 Julius Wijono https://www.listeninc.com/wp/media/logo.png Julius Wijono2025-09-09 14:29:432026-08-28 14:33:38Smart Glasses Audio Measurement

Creating Custom Python Steps in SoundCheck

September 3, 2025/in Blog, SoundCheck Tips Videos/by Julius Wijono

Bring your own functions into SoundCheck with custom Python steps! In this video, we’ll show you how to create and run a simple script, then integrate it into a SoundCheck sequence for powerful custom calculations without LabVIEW programming.

Additional Resources for SoundCheck

Detailed explanations of how to use SoundCheck can be found in the SoundCheck manual.

Video Transcript: Creating Custom Python Steps in SoundCheck

Python custom steps let you bring your own custom functions into SoundCheck without needing any LabVIEW programming knowledge. Let me show you how. 

I’m going to assume you already have the optional Python Custom Step module – that’s part number 2042 – installed and that you have already installed and configured Python with SoundCheck on your computer following the instructions in the SoundCheck user manual.

For this demo, I’m just going to create a very basic equation so that you can easily see how we’re handling the inputs and outputs, but the same principles apply whatever calculation you are working with.

Here I have a simple Python script I wrote called “square a value” which will make Soundcheck take the data values that you input and square them.

There is an editor configuration section which shows you how to define inputs and outputs and any parameters. In this case I have a ‘value in’ which is coming from SoundCheck which will be processed by this step. It’s just taking the value in the y data of the value in multiplying it by itself and then pushing it out as value out.

Now let’s see how this works inside Soundcheck. 

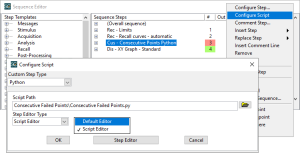
I’ll create a new sequence. Let me create a new custom step by right clicking on Custom, then New…, name the step “Square a value”. After entering the name, I’ll change the custom step type to Python and set the script path to my ‘square a value’ script that I just showed you. This “square a value” step now appears under Custom and I can drag this into my SoundCheck sequence. Once this has been added to the sequence, I can also Right Click > Configure Script to change my script path.

Now I’ll create an operator numeric step above the step which will ask the user to enter a value. I’ll call this original value, and I’m going to set the default value as five.

You’ll see the original value is in the memory list, and if I apply the step, the original value is populated on the y-axis with a value of five.

Now I’ll open my custom Python step.
We can see the step editor window, and you can see the value in and value out parameters. The value in has been auto selected but this can be changed if you have multiple input variables.

Now I’ll set my memory list name for the value out as “squared number”. This sends the “value in” parameter – my original value – from Soundcheck to the Python script we made earlier. The script now multiplies that value by itself, and outputs the result as “value out” which comes back into sound check as the squared number.

Let’s run the sequence.
We have our original value of five… and the result, our squared number as 25.

This is a very simple example, but it’s easily extended to more complex calculations, or configured with an existing Python library of custom calculations. Check out the SoundCheck manual for more information.

https://www.listeninc.com/wp/media/2025/08/Custom-Python-Steps-Blog-TN.png 1080 1080 Julius Wijono https://www.listeninc.com/wp/media/logo.png Julius Wijono2025-09-03 10:04:532026-08-27 14:04:13Creating Custom Python Steps in SoundCheck

Active Noise Cancellation Distortions in Headphones

August 29, 2025/in Blog, Headphone And Headset Papers, Papers/by Zarina

Active Noise Cancellations In Headphones - paperActive noise cancellation distortions in headphones are not straightforward to measure. Active Noise Cancellation (ANC)  effectively attenuates external background noises from droning airplane engine noise to everyday annoying environmental sounds. This permits greater enjoyment of music or speech, but at what cost? Like most signal processing, its benefits come with trade-offs such as added electronic noise and distortion. This paper uses several types of electroacoustic measurements to reveal some of these hidden trade-offs and attempts to explain how they affect the overall headphone playback sound quality.

Author: Steve Temme, Listen, Inc.
Presented at 2025 Audio Engineering Society Headphone Conference (August 2025) Espoo, Finland

Full Paper

Summary

Active Noise Cancellation Distortions in Headphones

This paper investigates the trade-offs of active noise cancellation (ANC) in headphones, demonstrating how signal processing can reduces traditional distortion while simultaneously degrading perceived sound quality. Although ANC effectively attenuates external noise—often by 10–40 dB, it introduces subtle distortions that standard electroacoustic metrics fail to capture.

Three high-end over-ear headphones from different manufacturers were evaluated using SoundCheck software, a head-and-torso simulator, and controlled background noise. Measurements included frequency response, total harmonic distortion (THD), intermodulation distortion (IMD), and perceptual quality using POLQA. Results showed that although ANC circuits can lower low-frequency distortion and improve seal compensation, they often also alter frequency balance, narrow soundstage, and create audible artifacts.

Intermodulation and normalized THD tests confirmed that ANC often reduces measured distortion, contradicting subjective impressions of worsened bass quality. However, time-domain analysis revealed residual and distorted audio, suggesting that ANC processing itself alters the signal beyond what frequency-domain metrics capture.

POLQA perceptual analysis correlated better with listener impressions: scores declined significantly with ANC engaged, especially in Bluetooth mode, highlighting the role of time variance and aggressive signal processing.

The paper concludes that while ANC improves noise attenuation, perceptual methods like POLQA and time-domain analysis are essential for evaluating sound quality, since traditional electroacoustic measurements alone obscure audible degradations.

https://www.listeninc.com/wp/media/2025/08/ANC-headphone-paper.jpg 1810 1280 Zarina https://www.listeninc.com/wp/media/logo.png Zarina2025-08-29 16:05:542025-08-29 16:05:54Active Noise Cancellation Distortions in Headphones

Using Statistics Across Multiple Signal Paths

August 19, 2025/in Blog, SoundCheck Tips Videos/by Julius Wijono

Run advanced statistics directly in your sequences with SoundCheck 23! In this video, we’ll show you how to apply statistical analysis across multiple signal paths, like microphone arrays, using new offline statistics features. Learn how to calculate mean, median, deviation, best/worst fit, and more.

Additional Resources for SoundCheck

Detailed explanations of how to use SoundCheck can be found in the SoundCheck manual.

Video Transcript: Using Statistics Across Multiple Signal Paths

The offline statistics mode is a new option which allows statistical functions previously available only from the offline menu to be used in a sequence.

Today I’m going to show you  how to use SoundCheck’s advanced options to run statistics across multiple signal paths within a sequence. This is something new we added in SoundCheck 23, so if you’re using an older version, you’ll need to upgrade to use this feature.

Here I have a six microphone array, and I want to run statistics across all 6 mics.

Let’s take a look at the statistics step from my sequence here…

There’s a couple of new features in statistics.

You can now apply a search range to eliminate certain ranges from your statistical analysis. Let’s exclude the low frequency points that might be outside the range of the speaker… let’s just do that now… I’ll set it from 80Hz to 20k.

Another useful new feature is that you can now drag and drop curves and groups of curves from the memory list, so here, I’ll bring over the group of responses from my six microphones.

Now, if you are more familiar with our older versions, you’ll notice that I now have a new option,  “offline analysis” available right here in the step editor. This is all the statistics functionality that used to only be available offline in earlier versions, but now you can run it in a sequence. Let’s select this…Now you can see the median function appears on the statistics tab and the distribution tab is enabled, giving us access to the best fit and worst fit options and histogram output. You can also apply a custom name to your statistical data. We’ll have it run a full set of statistics including maximum, minimum and mean, standard deviation, median and best fit to average.

Offline statistics resets after each sequence run, so that rather than running across sequential sequence measurements. It will run across responses acquired from multiple signal paths, such as a microphone array.

I already dragged over the RTA responses for the six microphones, so l et’s run the sequence and see how it processes the data.

On the upper left we have the RTA spectrums from the six mic array. The bottom left is the maximum, minimum, and mean. 

Here on the upper right we have the plus and minus three sigma and median curves. And the bottom right are the best and worst fit to average curves. We can see that the best fit is the RTA spectrum from mic 4 and the worst fit is from mic 1.

Also remember that we applied a 80 to 20k search range to the analysis, to exclude the low frequency portions of the RTA curves that are outside the operating range of the speaker so they don’t influence the statistics results.

The statistics module is included in all SoundCheck configuration packages, so if you have SoundCheck 23, check it out!

https://www.listeninc.com/wp/media/2025/08/Using-Statistics-Across-Multiple-Signal-Paths-Blog-TN.png 1080 1080 Julius Wijono https://www.listeninc.com/wp/media/logo.png Julius Wijono2025-08-19 12:08:372026-08-27 14:12:49Using Statistics Across Multiple Signal Paths

Listen, Inc.: Celebrating 30 Years of Audio Measurement Expertise

August 13, 2025/in Article Reprints, Blog/by Julius Wijono

This article celebrates 30 years of Listen, Inc., detailing the company’s journey from its inception in 1995 with the creation of SoundCheck, a software-based audio analyzer. Initially focused on replacing human listeners for end-of-line production testing, the company expanded its reach to research and development (R&D) as its software surpassed expensive hardware solutions. Over three decades, SoundCheck has consistently evolved, adapting to the changing audio landscape with features like multichannel capability and support for modern devices and interfaces.

Full Article

Listen, Inc.: Celebrating 30 Years of Audio Measurement Expertise

Back in 1995, I worked as an audio consultant, having recently returned from four years working as an applications engineer for Brüel & Kjær in Denmark. Creating a software based analyzer had been at the back of my mind for a while, but it took a conversation with the president of my consulting client, Sonetronics, to incentivize me to build it. We discussed the possibility of using software-based solutions on his production line, and although I failed to convince him to hire me to develop it, he agreed to buy it if I could deliver a solution within six months.

I worked by day and coded by night to meet the deadline, incorporating ideas I had nurtured for a while such as the stepped sine wave test signal and the HarmonicTrak algorithm. I showcased my product, and with a few minor tweaks, they bought it. I quickly saw the potential for this product and focused all my energy on continuing its development. I added the “sequence editor” a drag-and-drop interface to create customized audio tests, and several more measurement algorithms including higher-order harmonic distortion and normalized distortion measurements.

When I registered my company, Listen, Inc., named the product SoundCheck, and started promoting it, I never imagined that 30 years later, virtually every production line would use software for end-of-line test and these early algorithms would become the industry standard.

Chapters covered:

  • The First Decade (1995-2005)
  • The Second Decade (2005-2015)
  • Our Third Decade (2015 – 2025)
  • Commitment to Innovation

Full Article

https://www.listeninc.com/wp/media/2025/08/Listen_30years_LIS_2025_Page_1-scaled.png 2560 1950 Julius Wijono https://www.listeninc.com/wp/media/logo.png Julius Wijono2025-08-13 14:27:132025-11-13 14:43:18Listen, Inc.: Celebrating 30 Years of Audio Measurement Expertise

Innovation Timeline – 30 Years

August 10, 2025/in Blog/by Zarina

Listen’s 30 year history is rich with innovation. We’ve presented and published almost 30 research papers, many of which have driven the  measurement techniques used in our software. As we celebrate our 30th anniversary, we’re proud to share this timeline featuring some of our algorithms, techniques and product highlights.


  • 2025:


    Listen Celebrates 30 Years!

    Still under the leadership of its founder, Steve Temme, the company remains at the forefront of audio measurement, adding new features with every release and presenting research papers at conferences worldwide. Thank you to everyone who has been part of our success: employees past and present, industry colleagues, and of course, SoundCheck users.

  • 2025:

    AudioConnect 8x8 Launched

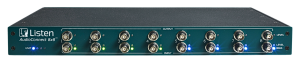
    The AudioConnect 8×8 audio interface is designed for accurate measurement in high channel-count applications. This high resolution interface offers 8 analog input and output channels plus 2 S/PDIF channels for digital signals. All input channels provide microphone power (constant voltage and constant current) and TEDS calibration support. Up to four AudioConnect 8×8’s can be connected for up to 32 synchronized analog input and output channels. AudioConnect 8×8 is fully configured via the software, making setup fast and easy, and allowing advanced features such as auto-ranging for maximum dynamic range measurements.


    2025:

  • 2025:


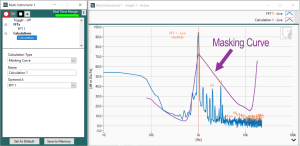
    Real Time Masking Curves Introduced

    SoundCheck is the first audio measurement software to offer real-time tonal masking and threshold-of-hearing curves in a spectrum analyzer. This demonstrates where a dominant tone is audibly masking other frequencies and noise to provide a clear visual correlation of measurements to audibility. When applied to a sound level spectrum measurement, the masking curves  automatically track the dominant tone, making any harmonics above the masking and threshold-of-hearing curves clearly visible. This simplifies diagnosis of the mechanisms causing the distortion.

  • 2024:

    Python Custom Step Introduced

    The Python custom step lets custom Python functions be called from a SoundCheck sequence, making it easy to pass data and variables between SoundCheck and other devices or programs, for example to send custom commands to put a device into diagnostic mode or to play a test signal from a device under test. It also enables communication with custom databases, and passing directional measurements to external programs.


    2024:

  • 2023:


    New Transient Distortion Algorithm - Enhanced Loose Particles

    Our enhanced Loose Particles algorithm brings a new level of accuracy and repeatability to transient distortion measurement, along with the ability to easily correlate measured results to audibility for easy limit setting. It uses the same time envelope analysis as our pioneering (2004) Loose Particles algorithm, but rather than filtering and counting pulses, additional analysis measures the prominence of the detected artifacts. This reflects the impulsiveness of the distortion more accurately than the absolute magnitude of the peaks. The algorithm allows the user to listen to the loose particle waveform with the stimulus removed, which enables easy correlation of the prominence threshold with audibility.


View Complete Timeline
https://www.listeninc.com/wp/media/2025/08/f-30logo-w.png 241 254 Zarina https://www.listeninc.com/wp/media/logo.png Zarina2025-08-10 16:59:052025-09-10 09:54:55Innovation Timeline – 30 Years

Calculating Voltage for Target SPL

August 5, 2025/in Blog, SoundCheck Tips Videos/by Julius Wijono

Want to measure your speaker at a specific SPL but not sure what voltage to use? In this video, we’ll show you how to calculate the exact test voltage needed to hit your target SPL using a simple SoundCheck sequence.

Additional Resources for SoundCheck

Detailed explanations of how to use SoundCheck can be found in the SoundCheck manual.

Pre-written test sequence to calculate the voltage level for a target SPL. You can modify it to meet your needs or incorporate the steps into your own test sequence.

Video Transcript: Calculating Voltage for Target SPL

In an earlier video, I demonstrated how you can increment the test voltage level to see the frequency responses at various levels. But what if you want to run a speaker measurement at a specific sound pressure level and need to know what test voltage level to use? 

I’ve written a short SoundCheck sequence to do this – let’s take a look.

First, the  sequence asks the user to enter the desired target level in dB SPL. I’ll put 94dB as an example. It plays through a 1kHz sine tone and calculates the sensitivity, then  implements a post-processing step to obtain the voltage level needed to output 94dB at 1kHz. The sequence then displays the calculated voltage level and the sensitivity level. 

The rest of the sequence verifies this by running a stepped sine sweep using the calculated voltage level and outputting the frequency response. You will notice that at the 1kHz mark, it reflects the target level I input earlier, which is 94dB SPL. 

This demo sequence can be downloaded from our website if you want to try incorporating it into your measurement sequences. Check it out, and if you have questions, please contact the Listen Support team.

https://www.listeninc.com/wp/media/2025/08/Calculating-Voltage-for-Target-SPL-Blog-TN.png 1080 1080 Julius Wijono https://www.listeninc.com/wp/media/logo.png Julius Wijono2025-08-05 07:00:022026-08-27 14:10:26Calculating Voltage for Target SPL

Car Audio Measurement – Part Two

July 29, 2025/in Audio Measurement Videos, Automotive Videos, Blog automotive audio, automotive audio demo, automotive audio measurement, automotive audio test, car audio, car audio demo, car audio measurement, car audio measurements, car audio test, car measurement, how to measure automotive audio, how to measure automotive audio part two, how to measure car audio, how to measure car audio - part two, listen demo, listen inc demo, listen inc measurements, soundcheck demo/by Julius Wijono

In this second part of our car audio measurement demo, we’ll be covering how to measure maximum SPL at the onset of audible distortion and detect impulsive distortion using advanced SoundCheck sequences. You’ll see how to identify buzz, squeak, and rattle with perceptual Rub & Buzz, transient distortion, and crest factor analysis.

Watch this Video Demo of Car Audio Measurement Techniques

Learn More about How to Perform Car Audio Measurements

Here are some additional resources:

  • Standardized Automotive Audio Testing Seminar: https://www.listeninc.com/standardized-automotive-audio-testing-seminar/
  • Automotive Audio Measurements Seminar (Frequency Response, Max SPL, Buzz, Squeak & Rattle): https://www.listeninc.com/automotive-audio-testing-seminar-2/
  • Standardized Automotive Audio Measurements (presented at ISEAT conference): https://www.listeninc.com/standardized-automotive-audio-measurements/

Video Transcript: How to Measure Car Audio – Part Two

Today, I’m going to continue on from our last automotive video where we measured frequency response, spectral uniformity, THD and IM distortion. This time we’ll  demonstrate Max SPL at the onset of audible distortion  and impulsive distortion. Let’s make some measurements.

Again, I’m using the test configuration recommended in the AES TC-AA white paper on automotive measurements. We’re using a precisely positioned 6-mic array in the driver’s seat to represent our listener. This is connected to  an AmpConnect 621 Audio Interface. Our laptop is also connected to a measurement-grade Bluetooth interface  which we’re using to send the stimulus signal into our car’s head unit. If you want to know more about the test configuration, you can download the AES white paper, and we also have full details on our website. The inputs and outputs of the test system are already calibrated, as is the  audio interface, so we’re ready to measure.

Maximum SPL is one of the measurements outlined in the TC-AA proposal, and it’s important because it lets you compare maximum sound levels of infotainment systems. It’s defined as the maximum sound pressure level that the infotainment system can reproduce, and it combines all the components of the system – the speakers, amplifiers, power supply and so on.

The simplest way of evaluating this is to measure the overall Max SPL and Max SPL spectrum regardless of distortion. In these tests we set the car’s volume control to maximum and measure overall Max SPL and SPL Spectrum simultaneously using a 30 second broadband 20 to 20 KHz monophonic pink noise stimulus at minus 12db FS . This is quite a basic measurement and I’ve demonstrated it in other videos, so we’ll just briefly discuss the results here, then I’ll demo a more advanced measurement. 

Here we see the individual microphone measurements and the average, the black line. The overall level of 103dBC, regardless of distortion, isn’t too loud but maybe it might be limited by design to prevent severe distortion at low frequencies from clipping the amplifier. 

What I’ll show you now is a Maximum SPL measurement at the onset of audible distortion. More volume is only good as long as the output sounds clean, so it makes sense to define the Maximum SPL based on when the sound quality starts to degrade.

This is a more complex test sequence and takes longer to run because you need to repeatedly play the stimulus until you reach distortion across a range of frequencies – similar to how we measure Max SPL in other applications. The good news is that this process can be highly automated in SoundCheck.

Our test sequence plays the stimulus multiple times for each test frequency, increasing the level in 3dB steps until the THD exceeds a predefined level in percent. It then reduces the level by 3dB and increases it in smaller increments of 0.5 dB to more precisely find the THD threshold. The Max SPL is recorded at that frequency and the test sequence continues to the next frequency. The entire process is completely automated via the test sequence, making this measurement fast with minimal intervention.

This sequence actually takes about 20 minutes to run in total, so I’ve edited this recording to skip the repetitive bits. We’ll set our range from 50 Hz up to 500 Hz, and we’ll set the percentage distortion. I’m going to set that at 3%. That means that once the distortion level goes above 3% it will record it and move onto the next frequency.

We’ll start at minus 12dB. The first thing it does is an auto range and it measures the time delay in the system… Now it’s playing 50 Hertz…It’s auto ranging. In a moment, it’s going to show the first result.

All right, here we go.

So, we can see the 50 Hertz sine wave of the 6 microphones capturing it, and we can see that we’re around 3.4% distortion.

So now it’s going to lower by 3 dB.

And it’s going to start going up again.

So now we’re 114 dB at 2.4%.

Now it’s going in half DB steps to very precisely find the sound pressure level at exactly 3%.

I’m just going to skip quickly through the next few measurements until we start graphing results

OK. We got 50, 63, and 80 Hz. You can see on the bottom graph is the input level and on the top graph we have the maximum sound pressure level versus frequency, the blue curve, and the orange curve is the THD level for that sound pressure level.

Again, I’ll fast-forward through the rest until we get our end result – it’s just more of the same at a bunch of different frequencies

OK, here’s our final result. The top graph shows the Maximum SPL and corresponding THD, and the lower graph shows the maximum stimulus level plotted when the THD reaches 3% with the head units’ volume control set to max.

At some frequencies, especially higher frequencies, for example 400 Hz and 500 Hz, the maximum input level is reached before the system distortion reaches 3% THD. The stimulus level is typically limited by the lower frequencies where there is more distortion.

So that’s it for system performance measurements. Now let’s look at system integrity.

Impulsive Distortion is a useful system integrity metric. It detects any audible buzz, squeak and rattle that may be caused by the speakers vibrating the door panels, loose wire harnesses, etc. These noises degrade the listener experience so it’s important to assess the vehicle thoroughly. It’s actually a good idea to make these measurements before you make the system characterization measurements, as this ensures that the infotainment system is properly installed in the vehicle under test

You can also use this test as an end-of-line check to verify vehicle integrity.

There are several methods of measuring impulsive distortion. The AES White Paper suggests a crest factor measurement with a logarithmic sine sweep and a tracking high pass filter, to evaluate impulsive distortion at 80 and 90 dBA. Sine waves have a crest factor of 3dB, and transients, such as rattling wires, loose fasteners, and noise, for example background noise, typically have a crest factor greater than 8dB. Generally speaking, crest factors over 3 dB, may indicate buzz, squeak or rattle. However, you have to be a bit careful as background noise, especially in a noisy factory, can result in similar Crest Factor results. You have to be very careful to minimize background noise and make sure that the results correlate with what you can hear.

I prefer to use perceptual Rub & Buzz and Transient distortion versus time instead, as they are less sensitive to background noise, and only highlight distortion sounds that are audible to humans. Perceptual Rub & Buzz uses masking curves to simulate the performance of the human ear to measure only audible distortion.  Transient distortion versus time measurement tracks individual events in the time domain to reveal any loose particles or rattling wires. It offers greater precision than frequency domain measurements since it tracks individual transient events.

I’ll measure both these parameters simultaneously, using a stepped sine sweep stimulus.

There’s a couple of frequencies there where I could hear some buzzing or rattling sound, I’m not sure if you could hear it. Let’s see if we pick that up in the measurement.

OK,  so here’s our recorded time waveform of all 6 mics.

And here… we can see the perceptual rub and buzz and indeed there’s a little bit of a peak going on at around 224 Hz and probably at a higher frequency here to around 340 Hz. These are the little buzzing sounds that we heard during the sweep.

Now, if we go to the bottom waveform graph, we can actually see if there’s any transients. Those are typically caused by things rattling around.

We don’t have much here – at low frequencies we don’t have a lot of output, so I suspect this is just background noise. So this car isn’t bad – just a little bit of Rub & Buzz and no transient artifacts.

I actually tried cranking the SPL up to 90dB to try to get some distortion at higher volumes, and here’s what I got…

Let’s just take a listen to the recorded response…. At this volume you can hear the distortion a lot more clearly.

Here we have the results of crest factor, Perceptual Rub & buzz and transient distortion.

The distortion is so obvious at this volume that it even shows up on the Crest Factor response – you can see the Crest Factor is above 8dB between 200 – 300 Hz.

It’s also much more obvious on the PRB curve – you can see a peak in the same point showing it correlates well. This is a little more sensitive than crest factor though –  we can also see a smaller, sharper bump at 600 Hz which is not perceptible using crest factor measurement, even though I could hear it during the sweep. This measurement technique is also considerably more reliable in a noisy environment.

This 3rd graph shows the time transients of the impulsive distortion measurement. You can see the constant background noise as a steady noise floor and impulsive distortion is highlighted as well-defined transient spikes. You can see transient spikes from 2 of the microphones around 11-12 seconds into the sweep. These are closer to the driver side door where a door panel is rattling at low frequencies, around 200-300 Hz, in the sine sweep. A neat trick with this measurement method is that you can actually listen to the recording without the fundamental, let me just play that back now… and that really highlights the audible distortion.

So that pretty much concludes our suite of measurements. There are of course many variations of these measurements as well as other things you could measure with the same physical hardware setup, but that’s all we have time for today. There are some more in-depth automotive audio testing videos on our website and YouTube channel, so if you want to learn more, check them out.

https://www.listeninc.com/wp/media/2025/07/Car-Audio-Demo-Part-Two-TN-scaled.png 1440 2560 Julius Wijono https://www.listeninc.com/wp/media/logo.png Julius Wijono2025-07-29 07:00:262026-08-28 14:26:17Car Audio Measurement – Part Two

Using Masking Curves for Measurement Insights

July 22, 2025/in Blog, SoundCheck Tips Videos/by Julius Wijono

Discover how masking curves in SoundCheck 23 bring psychoacoustics into your measurements with real-time tonal masking and threshold of hearing visualization – an industry first. In this video, we’ll show you how to use this new feature for production failure analysis and R&D insights by correlating what you see with what you hear.

Additional Resources for SoundCheck

Detailed explanations of how to use SoundCheck can be found in the SoundCheck manual.

Video Transcript: Using Masking Curves for Measurement Insights

A great new feature in SoundCheck 23 is the introduction of real-time tonal masking and threshold of hearing curves in the spectrum analyzer—an industry first. This lets you visualize how a dominant tone audibly masks other frequencies for a visual correlation between what we measure and what we hear. Let’s take a look at how to use it.

In production, it can give a deeper insight into failure analysis. Here, I have a small micro speaker. These designs are notorious for having rub and buzz problems around resonance due to their single-point suspensions. Let’s run our test sequence and examine the results.

The upper XY graph shows the fundamental and the enhanced perceptual Rub & Buzz (EPRB) curve. There’s a strong EPRB component focused right around 600 Hz. In the lower XY graph, we’re plotting the EPRB curve along with the electrical impedance curve, and we can see a strong correlation between the defect and the resonant frequency of the loudspeaker. On the waveform graph, zoomed in around 600 Hz, we can clearly see how distorted the waveform is.

Now, let’s use the masking curve tool to investigate this defect further. I’ll open up a saved virtual instrument configuration that contains a signal generator and the FFT analyzer – the two tools you need to use masking curves.

The test level in our sequence was 200 milliVolts, but I’ll start the signal generator at 70 milliVolts and 600 Hz. At this level, a couple of harmonics are visible. Now let’s add our masking curve. We’ll add a calculation and select “Masking Curve” from the dropdown list. Our calculation is now a masking curve. Its name is calculation one and our operand is the FFT1 live curve. Now on our graph we can see our fundamental tone, our masking curve, and we can see that harmonics 2 and 3 are well below the masking curve, suggesting they should be inaudible.

But now, watch what happens as we increase the test level. Around 150 mV is when perceptual Rub & Buzz really takes off. Now nearly all harmonics above the fifth up to the 20th or so are above the masking curve. Now when we bring this up to our final test level of 200 mV, nearly every harmonic up to the 30th is touching or above the masking curve, so we’d expect this to sound pretty bad. Let’s take a quick listen… and as we would expect, we can hear a lot of distortion.  

Finally, I’m going to remove the cursor and increase the frequency up to the point where the measured EPRB in our sequence should drop down. It’s doing some averaging, lets wait for it to settle. Now we can see at 800 hertz things have calmed down quite a bit. There’s still some visible harmonics but they’re pretty much at or below the masking curve. Let’s take it up to a kilohertz, now all our harmonics are below the masking curve and we should have a nice pure tone when we listen to it. 

So there’s a look at how one might use this new feature for failure analysis on a production line. It also has R&D applications, such as monitoring the effects of component size and quality during product development—for example, the contributions of the voice coil and magnet system to harmonic distortion. To learn more, check out the SoundCheck manual.

https://www.listeninc.com/wp/media/2025/07/Masking-Curves-Blog-TN-1.png 1080 1080 Julius Wijono https://www.listeninc.com/wp/media/logo.png Julius Wijono2025-07-22 07:00:342026-08-27 13:58:46Using Masking Curves for Measurement Insights

Stweep Turns 30: The Test Signal That Changed Audio Measurement

July 18, 2025/in Blog/by Julius Wijono

Everyone in audio test recognizes the ‘zip’ of the Stweep™, one of the world’s most ubiquitous audio test signals. But did you know it’s 30 years old this year? 

It was developed by Steve Temme and made its debut in the first commercially available version of SoundCheck, launched in 1995. Since then, it has been adopted on thousands of production lines and in development labs worldwide and is still the stimulus of choice for testing a wide range of electroacoustic products, ranging from simple speaker drivers to complex automotive infotainment systems.

But what exactly is a ‘Stweep’, how is it different from a stepped sine sweep, and why has it stood the test of time so well?

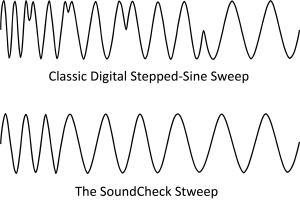
When you’re evaluating speakers, headphones, microphones, or other electroacoustic devices, the speed, accuracy, noise rejection and specific parameters that can be measured depend heavily on the stimulus signal used. Up until 1995, a standard stepped sine sweep was a popular choice for many electroacoustic tests as it produced results across a range of frequencies. This plays a sine wave at discrete frequencies, step by step, within a user-defined frequency range, and the user sets a resolution value to determine how many steps there will be.

Although extensively used, for example in the legendary Bruel and Kjaer 2012 analyzer, a stepped sine sweep has its limitations. It typically contains discontinuities because the frequencies do not change at a zero phase and amplitude crossing. This makes it slow as the device under test needs to settle at each new frequency. It is also inefficient at high frequencies where acoustic wavelengths are short, and potentially inadequate at low frequencies where settling times are long. The number of steps and their spacing are also critical. Too few steps can miss critical details; too many extend the test time unnecessarily.

In 1995 SoundCheck entered the market with the Stweep,  a new proprietary test stimulus. The Stweep is an optimized stepped sine sweep that generates an integer number of cycles at each frequency step. This ensures a smooth “zero crossing” transition from step to step. It is also phase-continuous from frequency step to frequency step, which makes it sound more like a sine chirp than a stepped sine sweep. This reduces transducer ringing and decreases settling time which yields faster and more accurate measurements. Settling time is further reduced by sweeping from high to low as low frequencies have more energy than high frequencies.

The Stweep is user-configurable with different resolutions and averaging times at high and low frequencies to optimize the trade-off between stimulus duration and resolution. This customization enables a much faster sweep, cutting test time to a fraction of what it would be using the previous stepped sine method. As well as speed and accuracy, the Stweep demonstrates good noise immunity and allows many test parameters to be measured in parallel including frequency response, phase, harmonics, intermodulation with two sine waves, perceptual distortion metrics, and impedance,with a single sine sweep.

Over the past 30 years, the Stweep has become synonymous with fast, reliable end-of-line testing. It remains unmatched in its ability to combine acoustic, electrical, and perceptual measurements in a single sweep—delivering the speed, precision, and noise immunity modern production demands. A smoother continuous transition and other refinements introduced in 2017 further optimized its performance for large frequency steps and equalized measurements. While others are only now beginning to adopt similar stimuli, Listen’s Stweep continues to lead as one of the most advanced and versatile signals in the audio test engineer’s toolkit.

Traditional Stepped Sine Sweep

https://www.listeninc.com/wp/media/2025/07/trad_stepped_sine.wav

Stweep

https://www.listeninc.com/wp/media/2025/07/stweep.wav


https://www.listeninc.com/wp/media/2025/07/Sweep-vs-Stweep.png 1572 2266 Julius Wijono https://www.listeninc.com/wp/media/logo.png Julius Wijono2025-07-18 10:22:572025-11-21 11:39:03Stweep Turns 30: The Test Signal That Changed Audio Measurement
Page 4 of 26«‹23456›»

Audio Measurement Expertise


How Changing Industry Needs are Shaping Audio Test and Measurement

Smarter SoundCheck Sequences with Loops and Logic

Audio Basics: Polarity

How to Measure: Haptics

The Value of Big Data

Audio Basics: Phase Response

view all

Latest News


2026 End Of Year Promotions

Celebrating 30 years: Listening – The Secret Of Our Success

Automotive Test Sequence Including BSR, Max SPL and Frequency Response

Listen Introduces AudioConnect 2, a New Portable Dual-Channel Audio Interface

SoundCheck 21 Brings Enhanced Loose Particle Detection, Multichannel FFT, Metadata, Sequence Protection and more


Audio Measurement Expertise – Delivered Monthly


ABOUT LISTEN INC

Listen is a global leader in audio measurement and analysis, with over 30 years’ experience developing innovative test methods and algorithms. SoundCheck, our powerful software-based audio analyzer, pairs with our test interfaces, precision microphones, and accessories to offer a complete solution for testing loudspeakers, headphones, microphones, smart devices, communication systems, hearing aids, automotive audio, and more. Trusted by engineers worldwide, Listen delivers the accuracy and flexibility essential for modern audio testing, from the R&D lab to the production line.

PRODUCTS
APPLICATIONS
SUPPORT
RESOURCES
NEWS & EVENTS
ABOUT

CONNECT

YouTube
LinkedIn
LinkedIn
Share
Instagram

Copyright © Listen, Inc.   |   Privacy Policy   |   AI Disclosure
  • Instagram
  • LinkedIn
  • Youtube
  • Mail
Scroll to top